Usually, a GPU (Graphics Processing Unit) temperature range lies within the range of 65 to 85°C (149 to 185°F). If the GPU temperature exceeds the maximum value, like around 100°C, you can try controlling the tolerable heat levels accordingly if you know the current GPU temperature. Overheating of GPU can result in severe hardware damage, so we recommend checking the GPU temperature.
This gearupwindows article will guide you on checking and monitoring the Graphic Card’s temperature on your Windows 11/10 PC. Whether you are a gamer, video editor, or graphics designer, the software we mention in this post will help you all. Apart from the third-party freeware tools, you can also use Windows’ built-in Task Manager. Here is how to do it.
How to Check the GPU Temperature in Windows 11/10?
As mentioned above, we will review the built-in Windows Task Manager and third-party free applications to view the GPU temperature in Windows 11/10.
Windows 11/10 Task Manager
The built-in Windows Task Manager is a handy utility to manage processes, services, startup apps, and more. Apart from that, it lets you monitor GPU temperature quickly. Microsoft has added this functionality to Task Manager in Windows 10 18963 and newer builds. You can watch the GPU temperature from the Performance tab of the Task Manager.
Although Microsoft offers the functionality to monitor the GPU temperature in Task Manager, this feature only works with dedicated GPUs and not with onboard or integrated GPU cards. Furthermore, you may also need an updated graphics driver to view GPU temperature. It requires an updated graphics driver to WDDM 2.4 or a newer version.
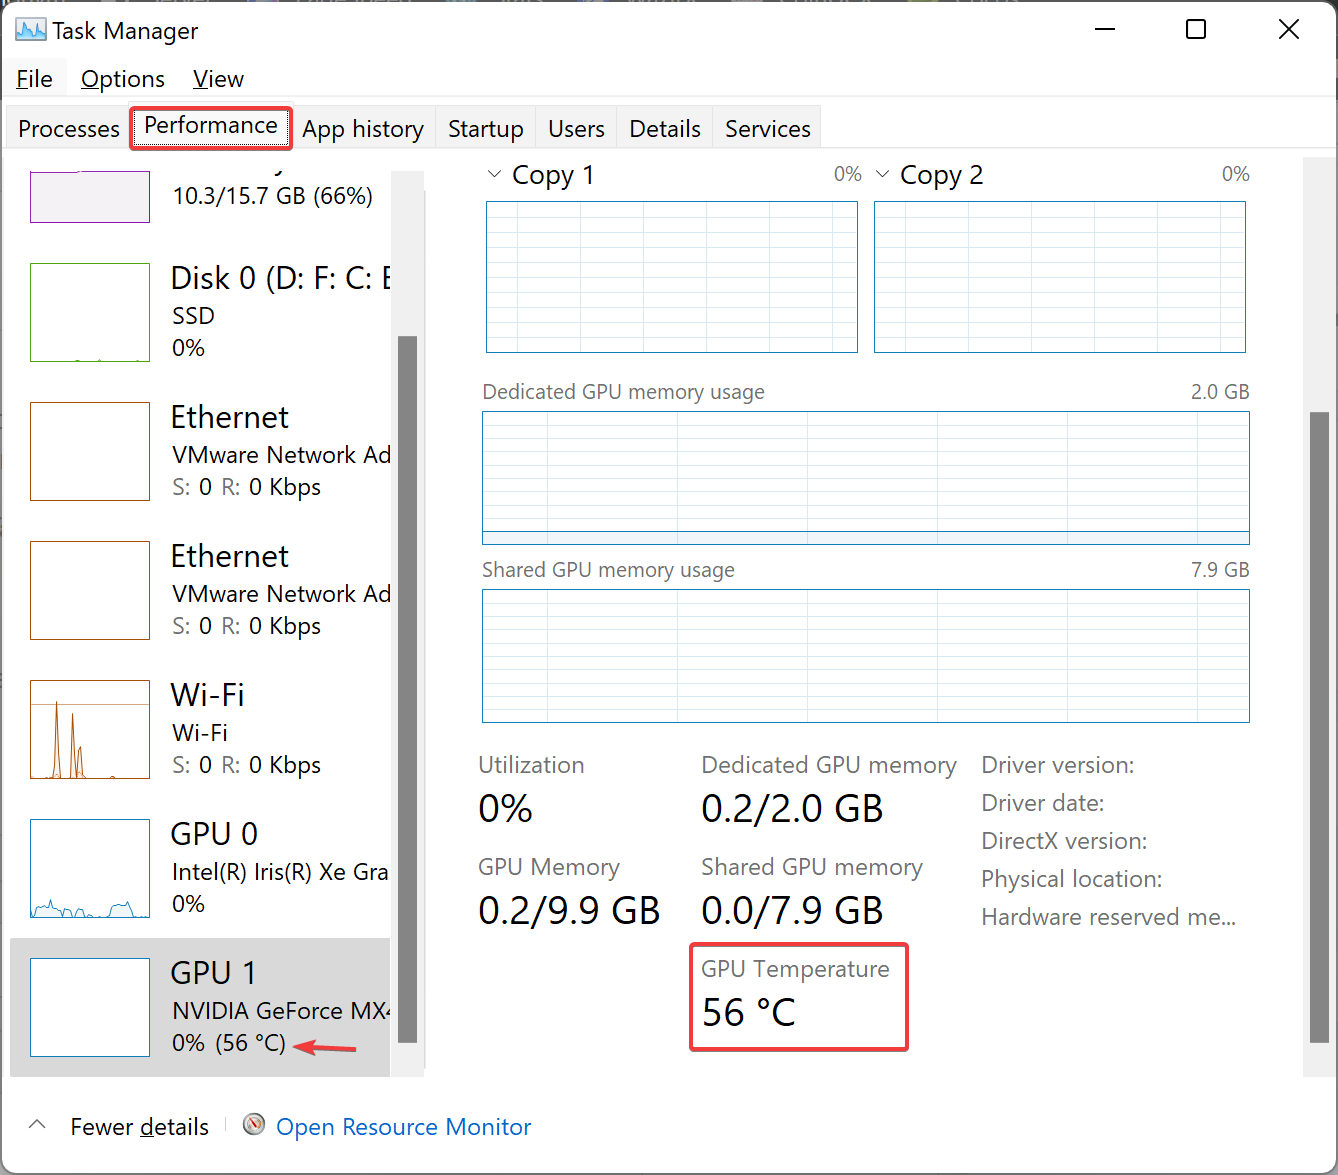
To check and monitor GPU temperature in Task Manager on your Windows 11/10 PC, first, open Task Manager using Ctrl + Shift + Esc hotkey. When Task Manager opens, navigate to the Performance tab.
Here, you will see the GPU temperature listed in the left pane. After selecting the GPU entry, you can also view its temperature and several other statistics on the right-side pane.
GPU-Z
As the name suggests, GPU-Z is a dedicated and free application to monitor GPU for Windows 11/10. Using this software, you can check GPU temperature and many more statistics related to your graphics card. It supports all major graphics cards, including NVIDIA, AMD, ATI, and Intel graphics devices. So, if you have any of these GPU cards, you can easily monitor their temperature.
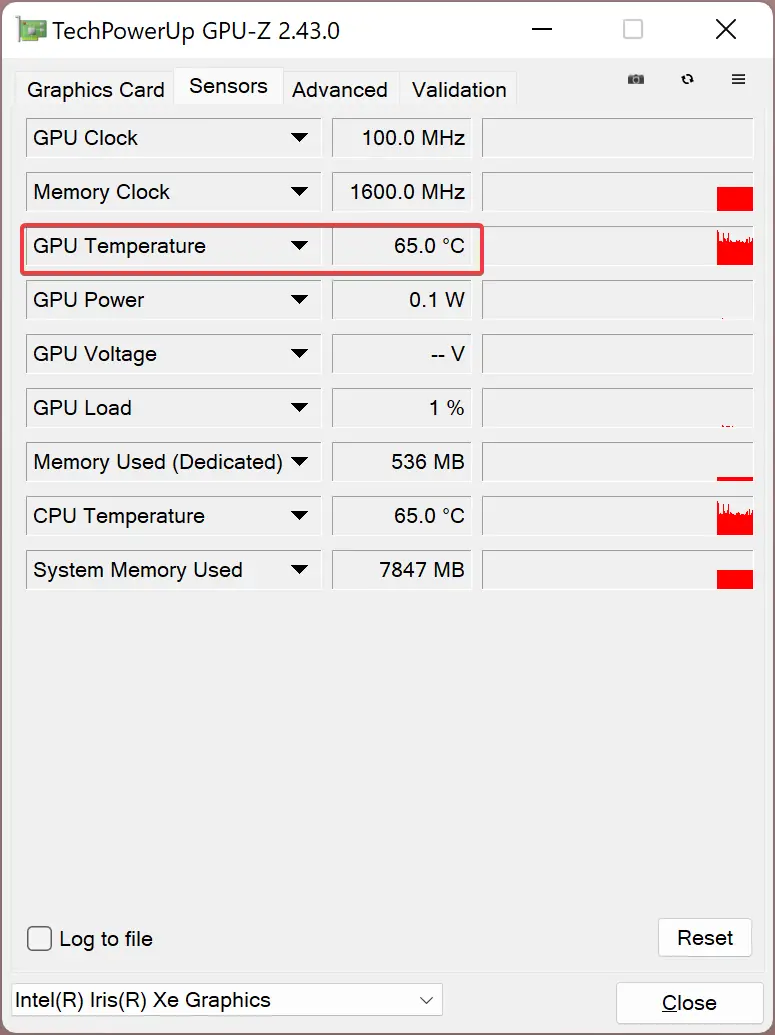
GPU-Z is a portable application, so you don’t need to install it. Once you download and run this application, go to the Sensors tab to watch the real-time GPU temperature with a small graph. When you click on the drop-down button beside the GPU Temperature, you can view the current, lowest, highest, or average reading.
If you have installed multiple GPU cards on a single PC, you can select the one you want to monitor from the bottom of the Sensors tab. Apart from temperature, you can also check statistics like GPU clock frequencies, GPU Voltage, GPU Load, CPU Temperature, System Memory Used, and more.
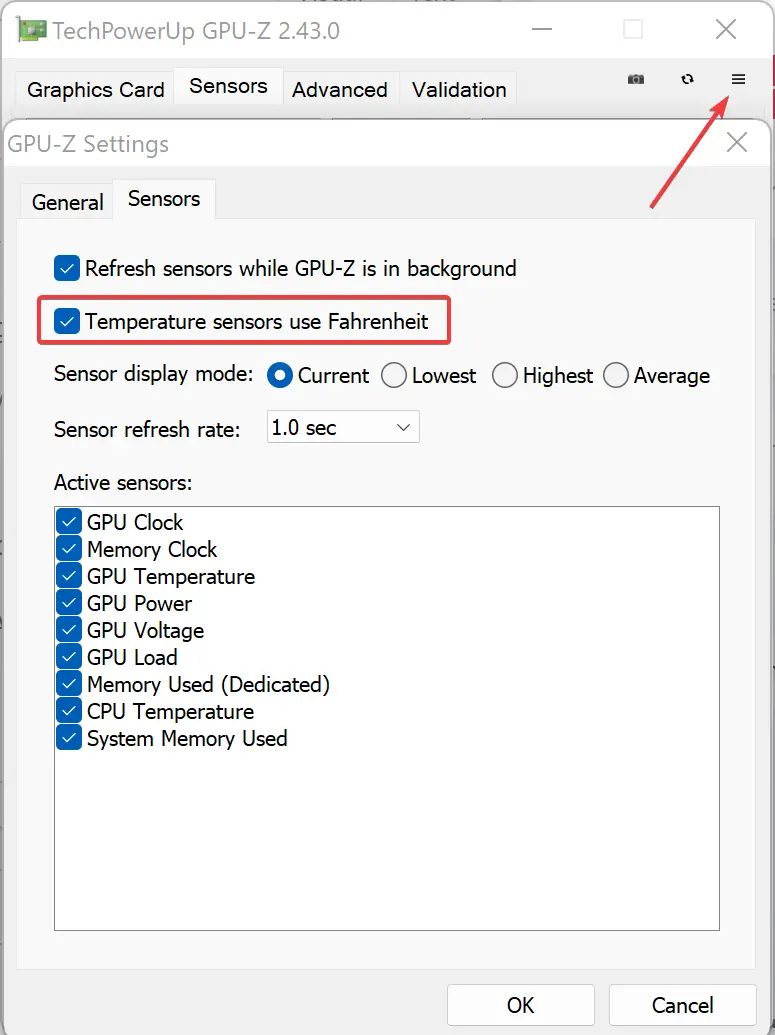
By default, GPU-Z shows GPU temperature in Celcius. If you need, you can change the temperature unit to Fahrenheit. To do that, click on the three-bar menu button at the top of the screen and then move to the Sensors tab in the Settings window. From here, check the box “Temperature sensors use Fahrenheit.”
HWMonitor
HWMonitor is another dedicated GPU monitor software for Windows 11/10. This application allows you to check various GPU statistics, including temperature, voltage, fan speeds, powers, utilization, clock frequencies, capacities, and more. Apart from GPU, you can also monitor CPU temperature, SSD temperature, utilization, etc.
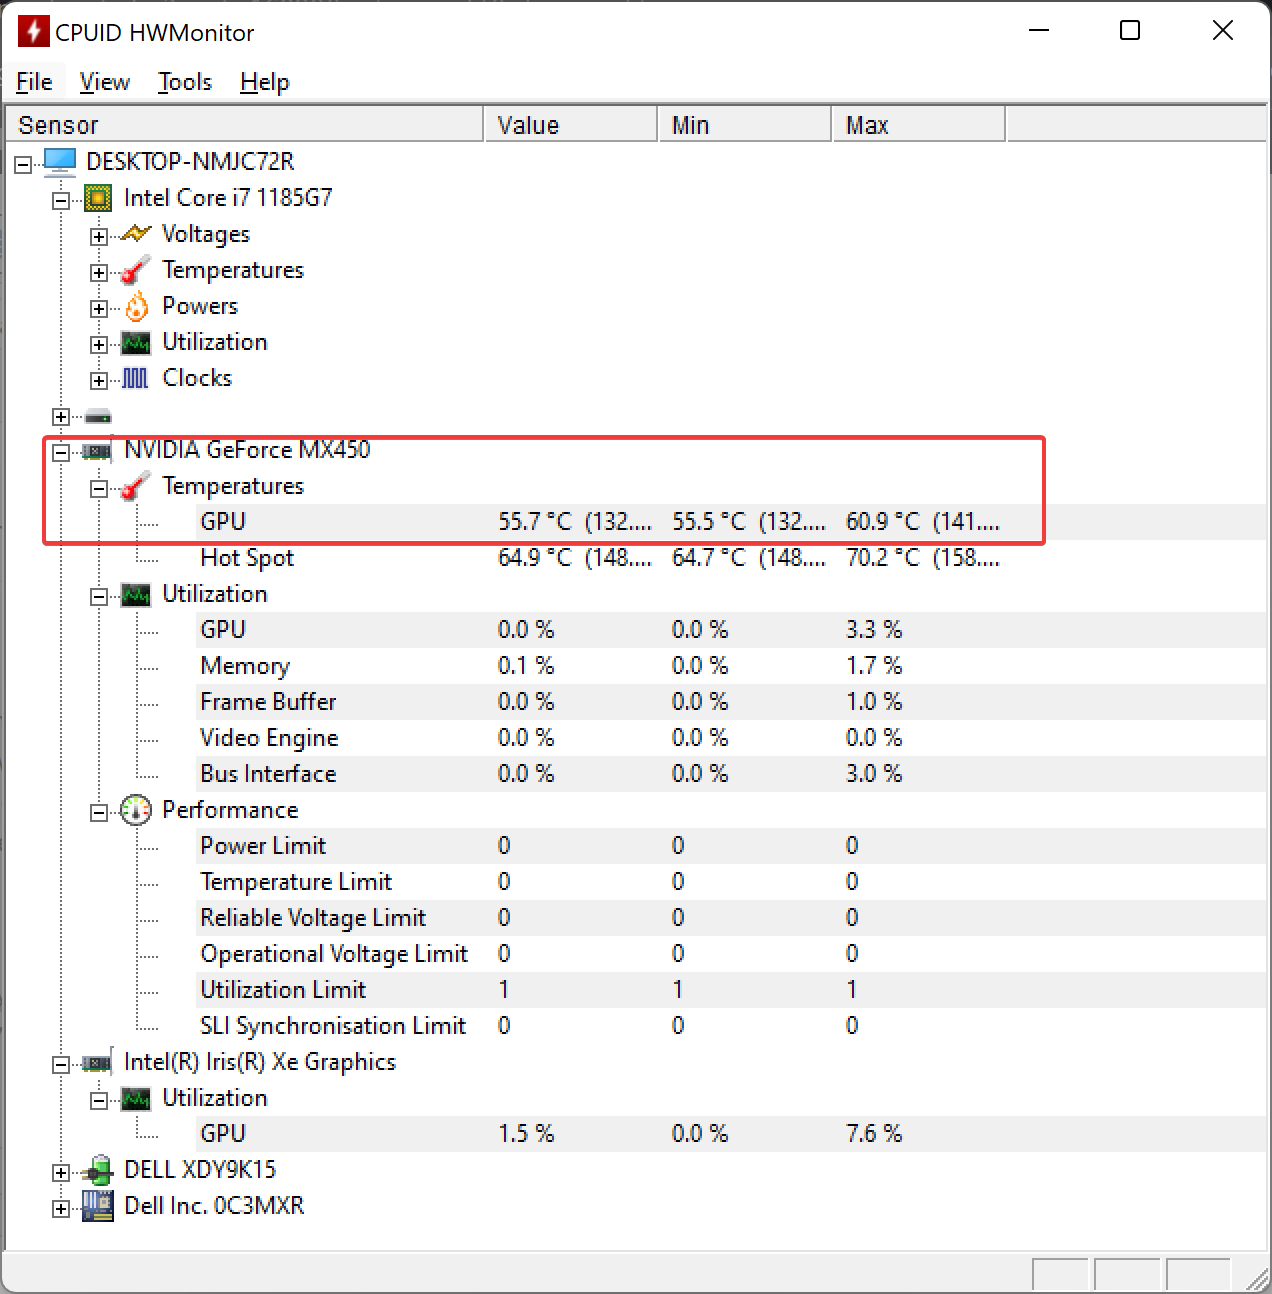
To monitor GPU temperature, download and install HWMonitor on your system. After that, launch the software, and it will show numerous real-time statistics related to your hardware. Then scroll down, and you will see your graphics cards listed. Expand it and view the real-time GPU temperature. It also shows the minimum and maximum GPU temperature values and analyzes the current temperature value based on that.
Open Hardware Monitor
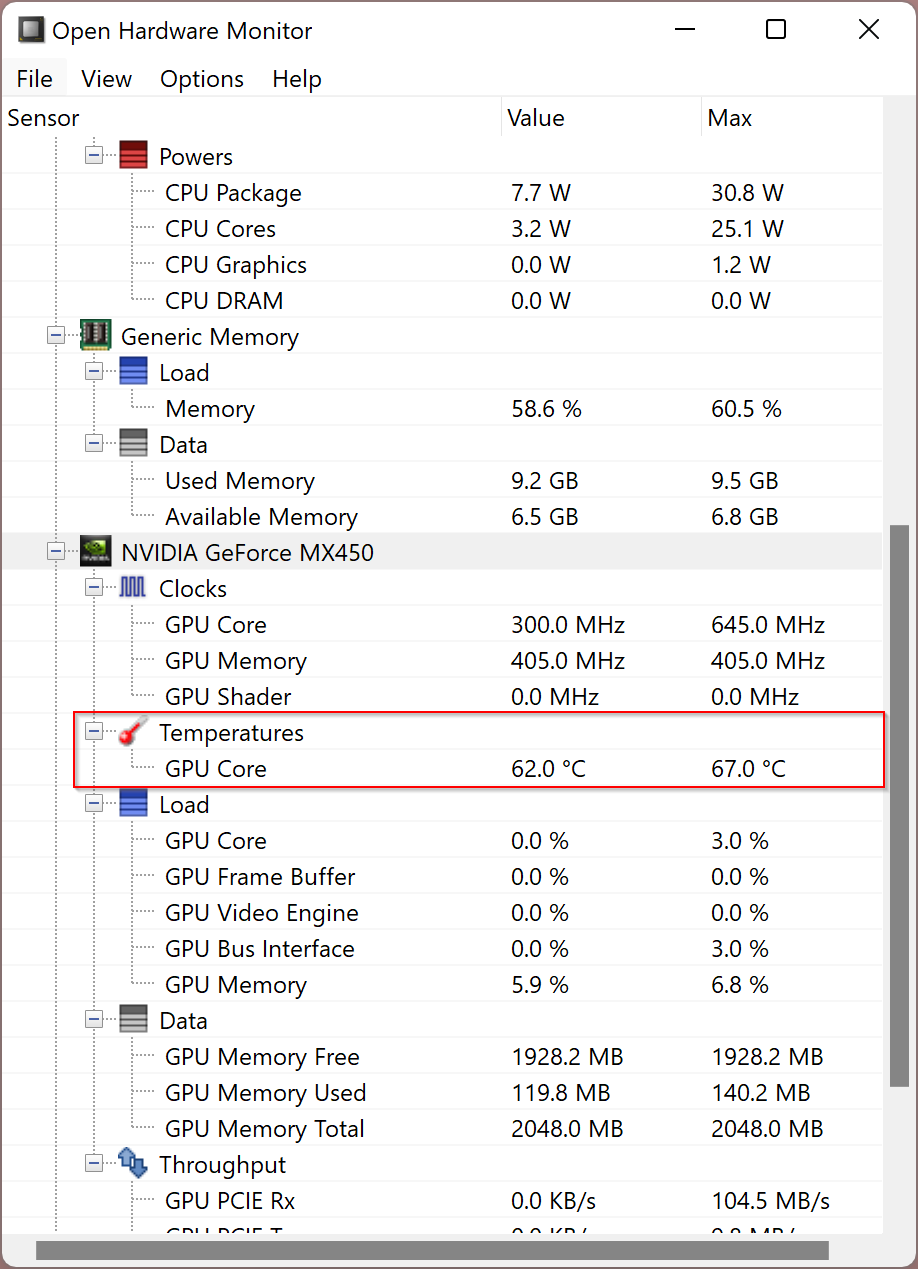
Open Hardware Monitor is another free and open-source hardware monitoring software that lets you check GPU temperature and other related statistics. This freeware app lets you monitor your computer’s temperature, fan speeds, voltages, load, and clock speeds. At present, it supports ATI and Nvidia video cards for GPU monitoring. It also allows you to monitor the SMART hard drive and CPU temperature.
It is portable software, so there is no need to install it on your system. Download the ZIP file, extract its contents in a folder, and then double-click on the executable file to launch the application. You can view different components on its main interface, including CPU, SSD, Memory, and more. Please scroll down to find your GPU card listed along with its temperature. It also shows the minimum and maximum values for temperature and other metrics to maintain the required values.
This freeware software also allows you to customize several parameters related to the statistics that are being displayed. For instance, you can change the temperature unit from Celcius to Fahrenheit. Furthermore, you can adjust log intervals, enable sensor logging, select plot location, select which hardware you want to monitor, etc. Apart from that, it allows one to view the statistics graph, enable the monitoring gadget, and view hidden sensors. You can also save the hardware statistics to a Text file from its File menu.
Sidebar Diagnostics
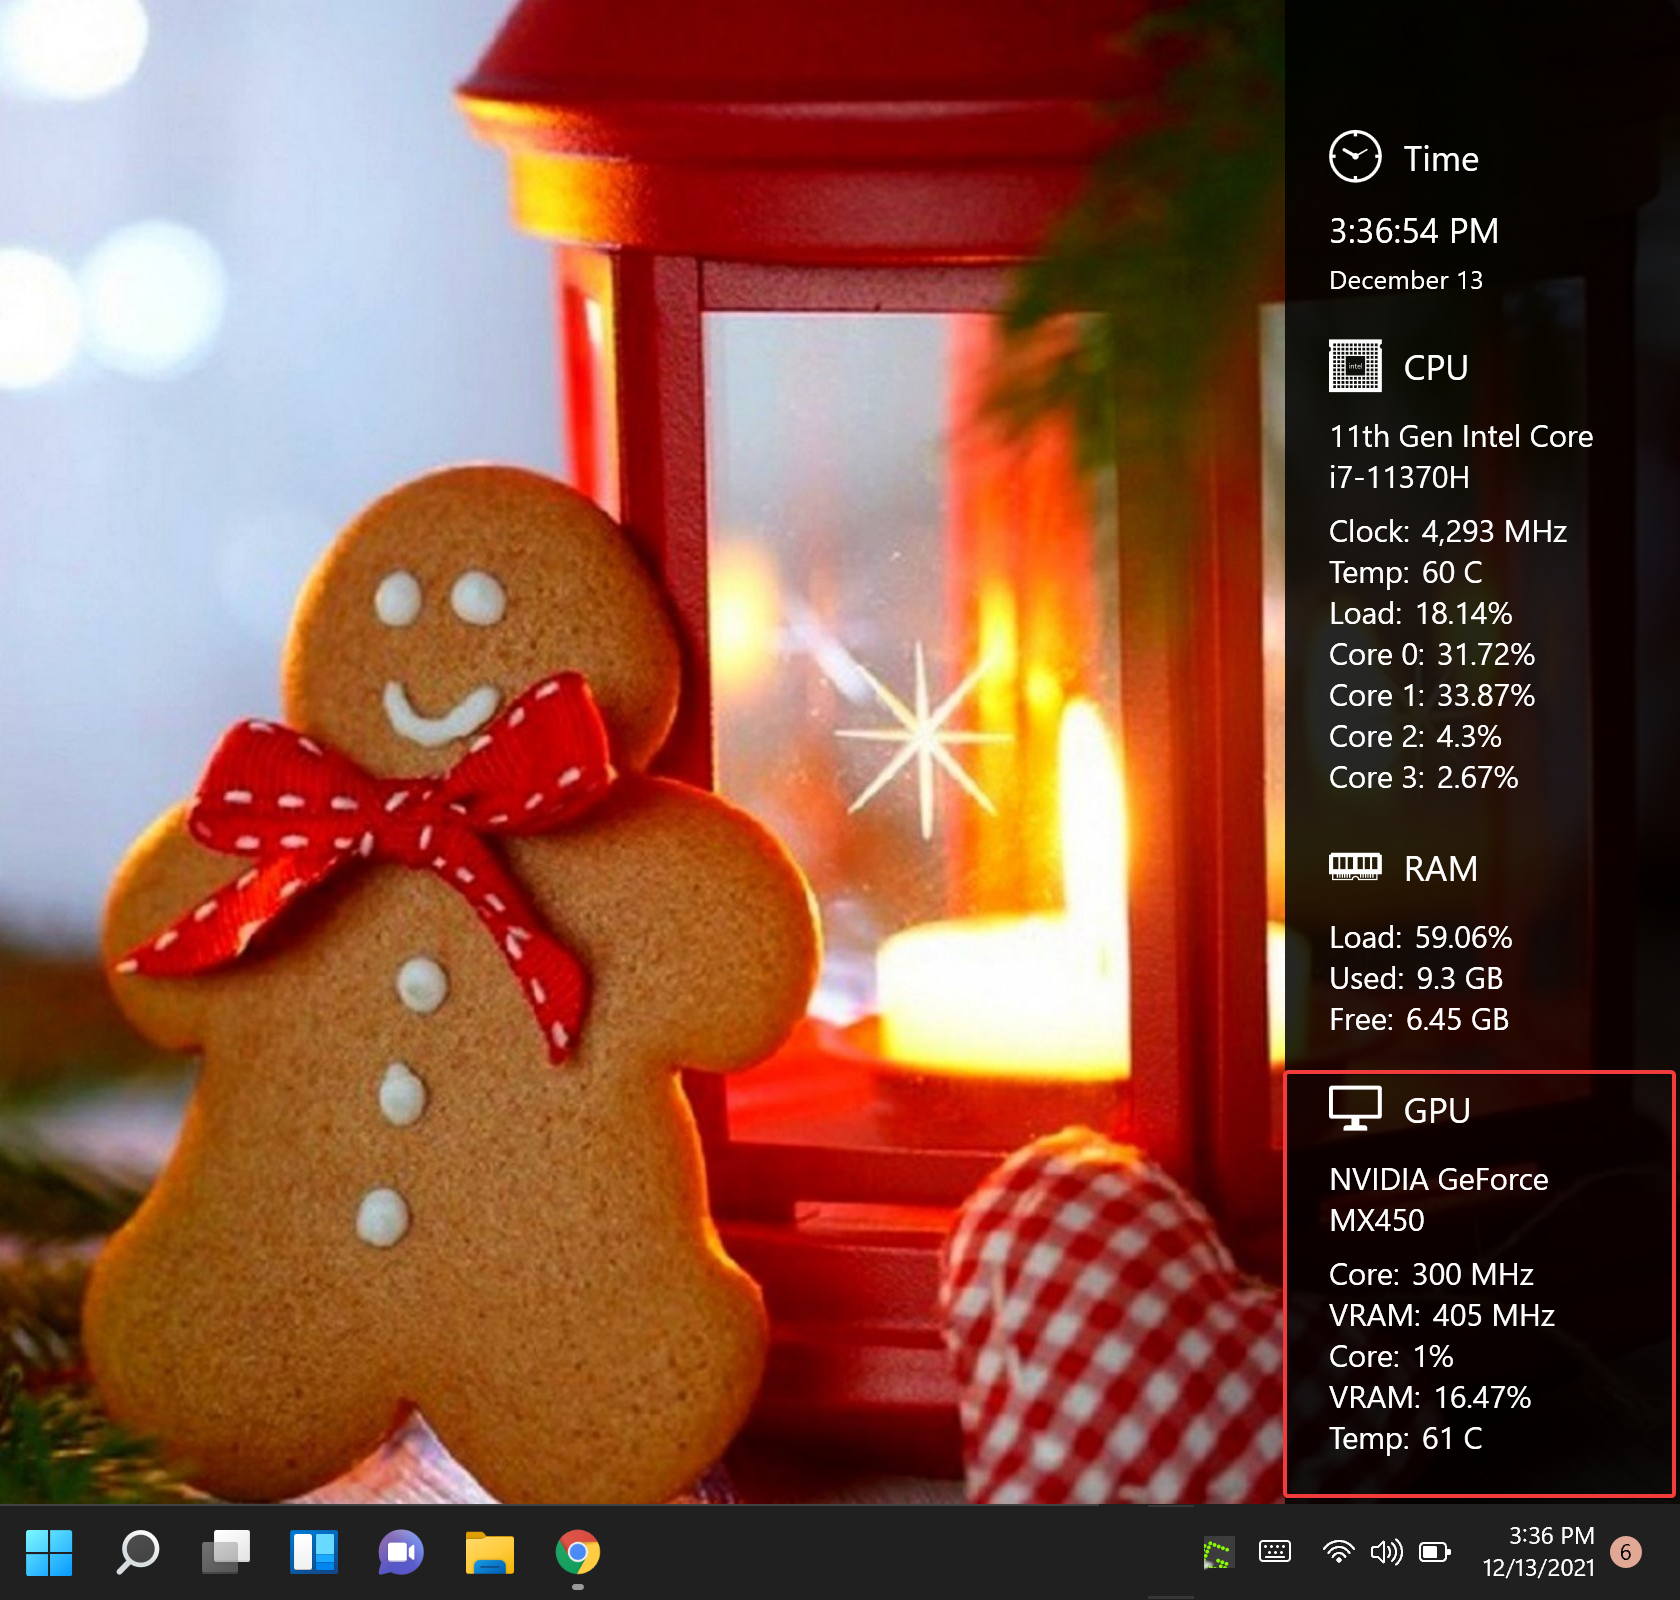
Sidebar Diagnostics is another free GPU monitor software for Windows 11/10. It is different from others that are listed in this post. It is a system information checking tool that shows advanced information related to the operating system, including CPU, RAM, GPU, Storage, Drives, Audio, and Network.
Once you download, install and launch Sidebar Diagnostics, it is added to the sidebar on your desktop screen and shows you GPU temperature and many more real-time statistics. If you need, you can also visualize the GPU statistics graph by clicking on the graph icon from the top of the sidebar. Apart from that, this software lets you customize the metrics and duration of the chart as per your requirement. You can customize various settings related to this software, such as sidebar width, polling interval, UI scale, click-through, background color, background opacity, font size, font color, date format, alert blink, and more. This application lets you customize hotkeys for various events, including toggle, show, hide, switch edge, switch screen, reserve space, etc.
Speccy
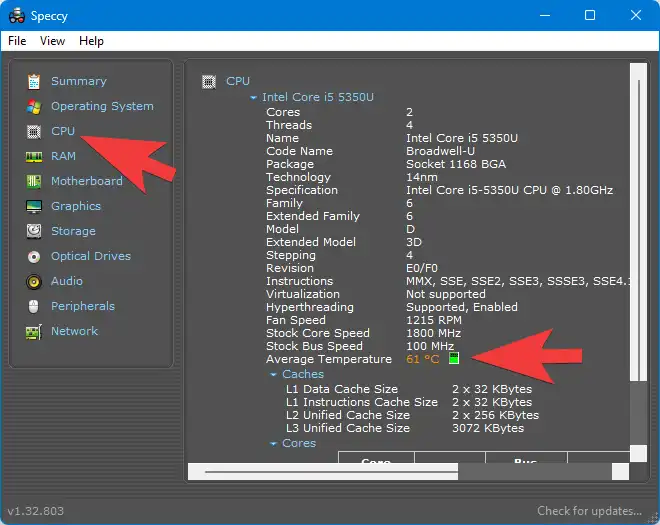
Speccy is a powerful and user-friendly software tool that provides comprehensive system information for Windows 11/10 users. One of its standout features is the ability to check GPU temperature, which is essential for monitoring the health and performance of your graphics card. With Speccy, you can easily access real-time temperature readings and gain valuable insights into your GPU’s thermal status.
By utilizing Speccy’s GPU temperature monitoring capabilities, Windows 11/10 users can effectively manage their system’s cooling efficiency and prevent potential overheating issues. With a simple and intuitive interface, Speccy displays the current temperature of your GPU, allowing you to track any fluctuations during demanding tasks or gaming sessions. Armed with this information, you can take proactive measures such as adjusting fan speeds, optimizing cooling solutions, or adjusting graphics settings to maintain optimal GPU temperature and ensure smooth and stable performance. Speccy empowers users to keep their graphics card in check and enjoy a reliable computing experience.
To check the temperature of the CPU, download, install, and launch Speccy on your system. Then, switch to the CPU tab in the left sidebar, and on the right pane, you can view the average temperature of your CPU along with other details.
Core Temp
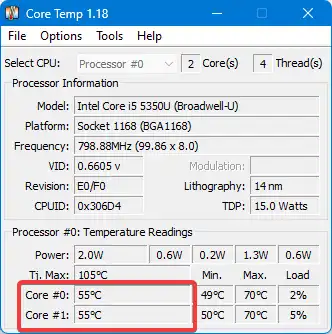
Core Temp is a reliable and user-friendly software tool that enables you to monitor the temperature of your CPU with ease. With real-time temperature readings for each individual core, customizable alerts, and a lightweight interface, Core Temp allows you to keep a close eye on your CPU’s thermal performance, preventing overheating and ensuring smooth operation. Download Core Temp today and optimize your computer’s temperature management for enhanced performance and longevity.
Conclusion
In conclusion, checking and monitoring your GPU temperature is essential to prevent severe hardware damage. The GPU temperature range should typically fall between 65 to 85°C (149 to 185°F), and any temperature exceeding this range can cause significant harm. In addition to the built-in Windows Task Manager, several free third-party applications such as GPU-Z, HWMonitor, Open Hardware Monitor, Sidebar Diagnostics, Speccy and CPU Temp can help you monitor GPU temperature and other statistics related to your graphics card. These applications allow you to view real-time GPU temperature, voltage, fan speed, power, utilization, clock frequency, and other metrics to help you keep track of your GPU performance. By monitoring the GPU temperature, you can adjust tolerable heat levels accordingly to maintain optimal performance and avoid hardware damage.