Microsoft Excel is a powerful tool for data manipulation, analysis, and visualization. Whether you’re working with financial data, managing inventories, or conducting scientific research, you often need to identify the smallest or largest number within a dataset. In this gearupwindows article, we’ll explore various methods to help you find the smallest or largest number in Excel, from simple formulas to advanced techniques.
How to Find the Smallest or Largest Number in Excel?
Method 1: Using MIN() and MAX() Functions
The simplest way to find the smallest or largest number in Excel is by using the built-in MIN() and MAX() functions. These functions provide a quick and easy solution to identify these extreme values.
For finding the smallest number:-
=MIN(A1:A10)
This formula will return the smallest number in the range A1 to A10.
Let’s say you have the following data in cells A1 to A10, and you want to find the smallest and largest numbers in this range:-

The formula will return the value 12, which is the smallest number in the range.
For finding the largest number:-
=MAX(A1:A10)
This formula will return the largest number in the same range.

In this example, this formula will return the value 90, which is the largest number in the range.
Method 2: Conditional Formatting
Conditional formatting is a powerful feature that can visually highlight the smallest or largest numbers within your dataset, making them easy to identify. Here’s how you can use it:-
Step 1. Select the range of cells where you want to identify the smallest or largest number.
Step 2. Go to the “Home” tab and click on “Conditional Formatting” in the “Styles” group.

Step 3. Choose “New Rule.”
Step 4. In the “New Formatting Rule” dialog, choose “Format only cells that contain.”

Step 5. Set the condition to “Cell Value,” “less than,” and then specify the minimum value you are interested in. Let’s say you want to find and highlight the smallest number, which is less than 50.
Cell Value: Less than
Minimum: 50
Similarly, set the condition to “Cell Value,” “greater than,” and then specify the maximum value you are interested in. Let’s say you want to find and highlight the largest number which is more than 50.
Cell Value: Greater than
Minimum: 50
Step 6. Click the “Format” button to specify how you want the smallest/largest number to be formatted. For instance, you can change the font color to red to make it stand out.
Step 7. Click “OK” to apply the formatting.
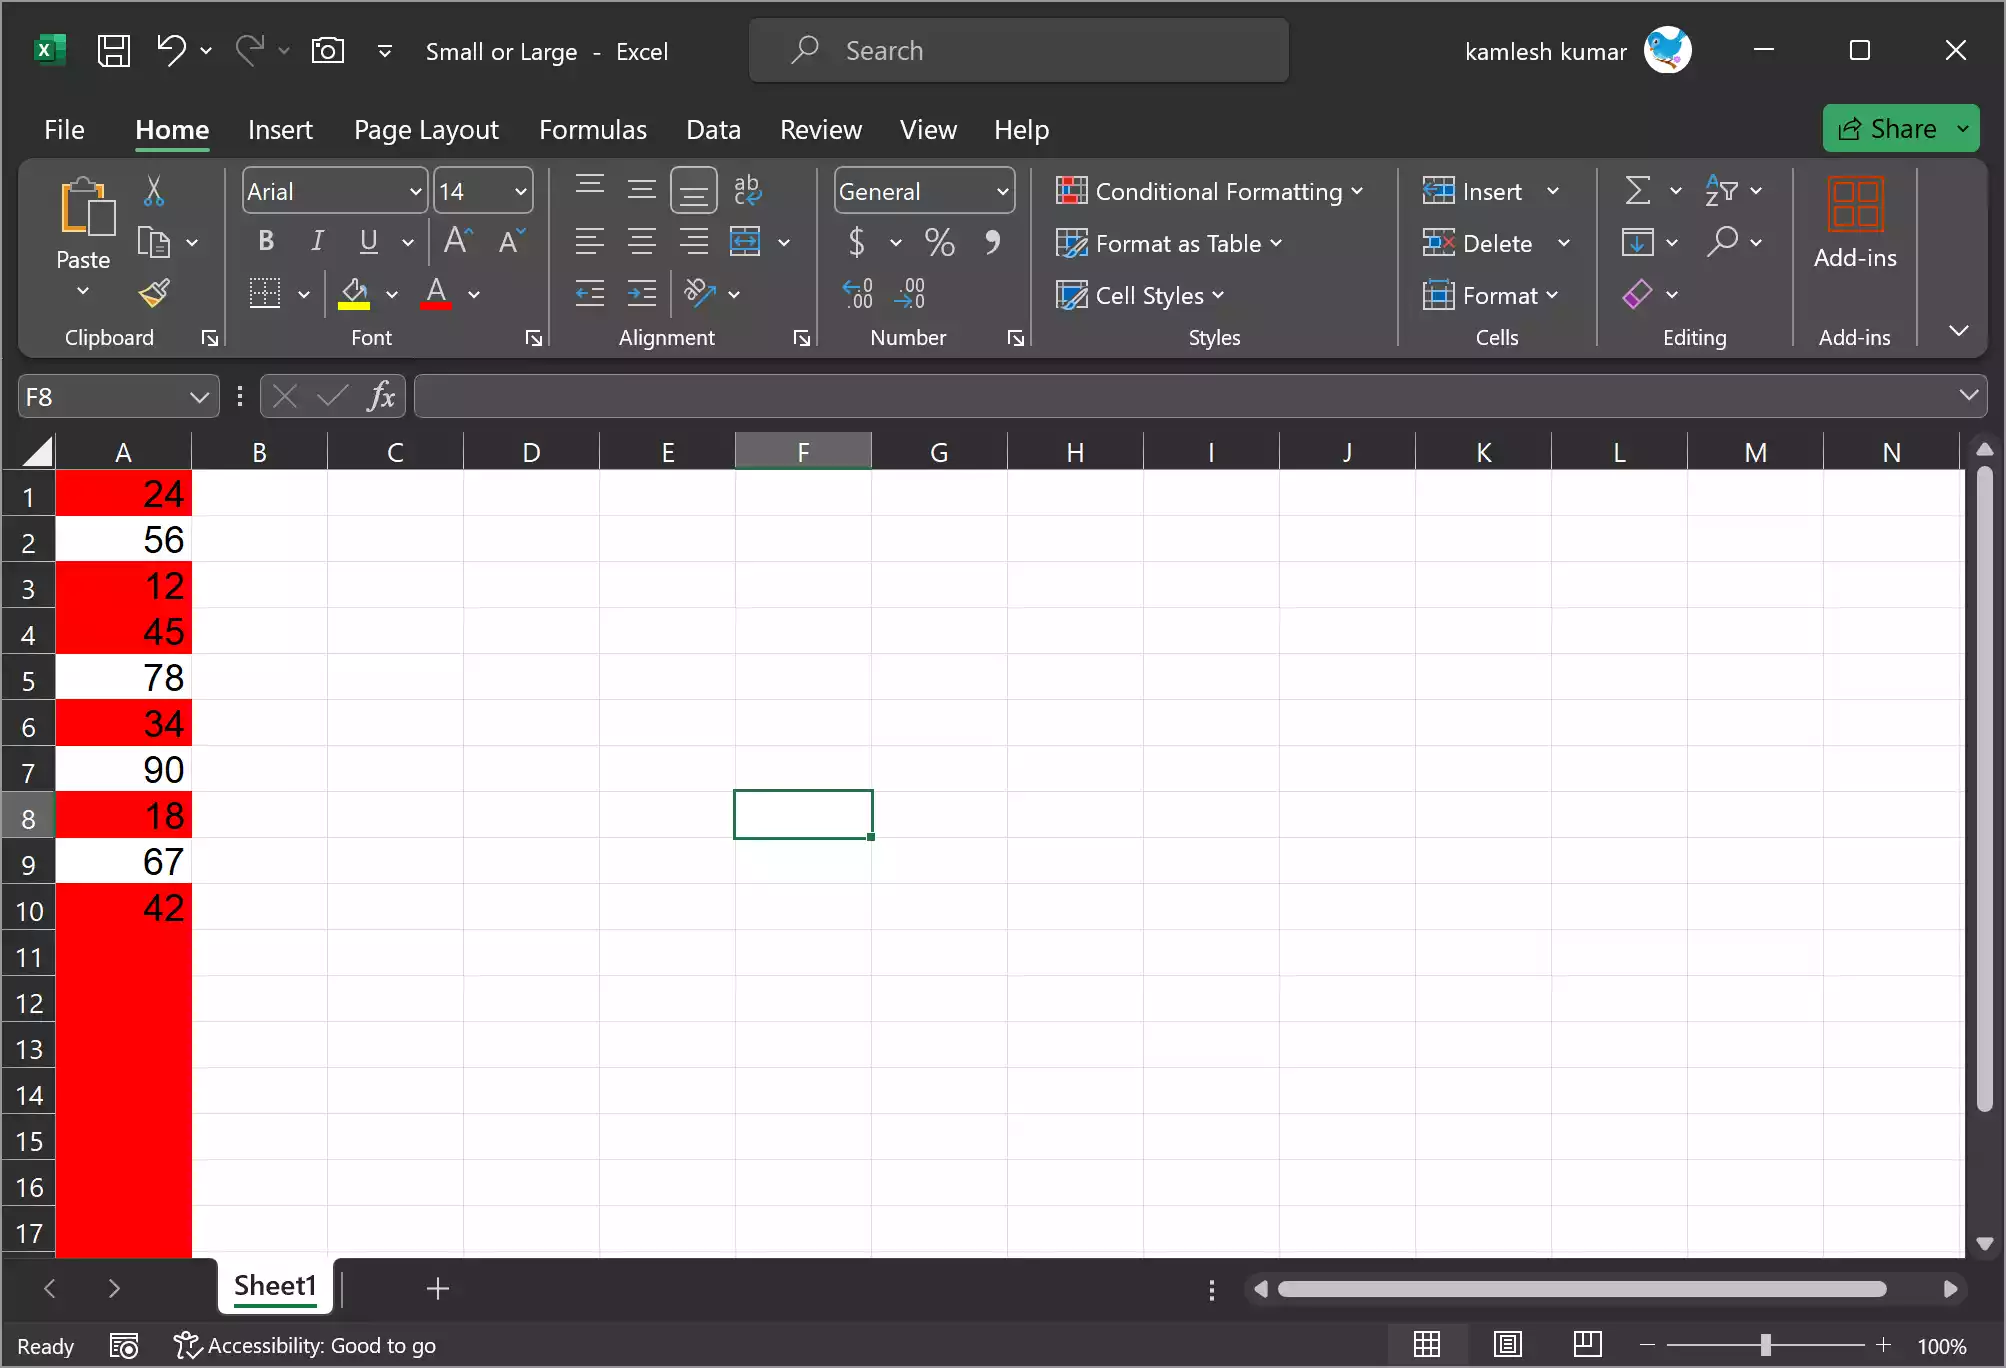
Now, Excel will automatically format the smallest and largest numbers, making them easily identifiable.
Method 3: Sort and Filter
Another way to find the smallest or largest number in Excel is by sorting and filtering your data. Here’s how:-
Step 1. Select the range containing your data.
Step 2. Go to the “Data” tab and click on “Sort.”

Step 3. In the “Sort” dialog box, choose the column you want to sort by (e.g., Column A) and select “Smallest to Largest” to find the smallest number or “Largest to Smallest” to find the largest number.
Step 4. Click “OK” to apply the sort.
The smallest or largest number will now be at the top of the sorted list. To make it even more user-friendly, you can use Excel’s AutoFilter feature. Just click the filter icon in the column header and select the number range you’re interested in.
Method 4: Using the AGGREGATE Function
The AGGREGATE function in Excel is a versatile tool that can be used to find the smallest or largest number while ignoring hidden or error values. Here’s how to use it:-
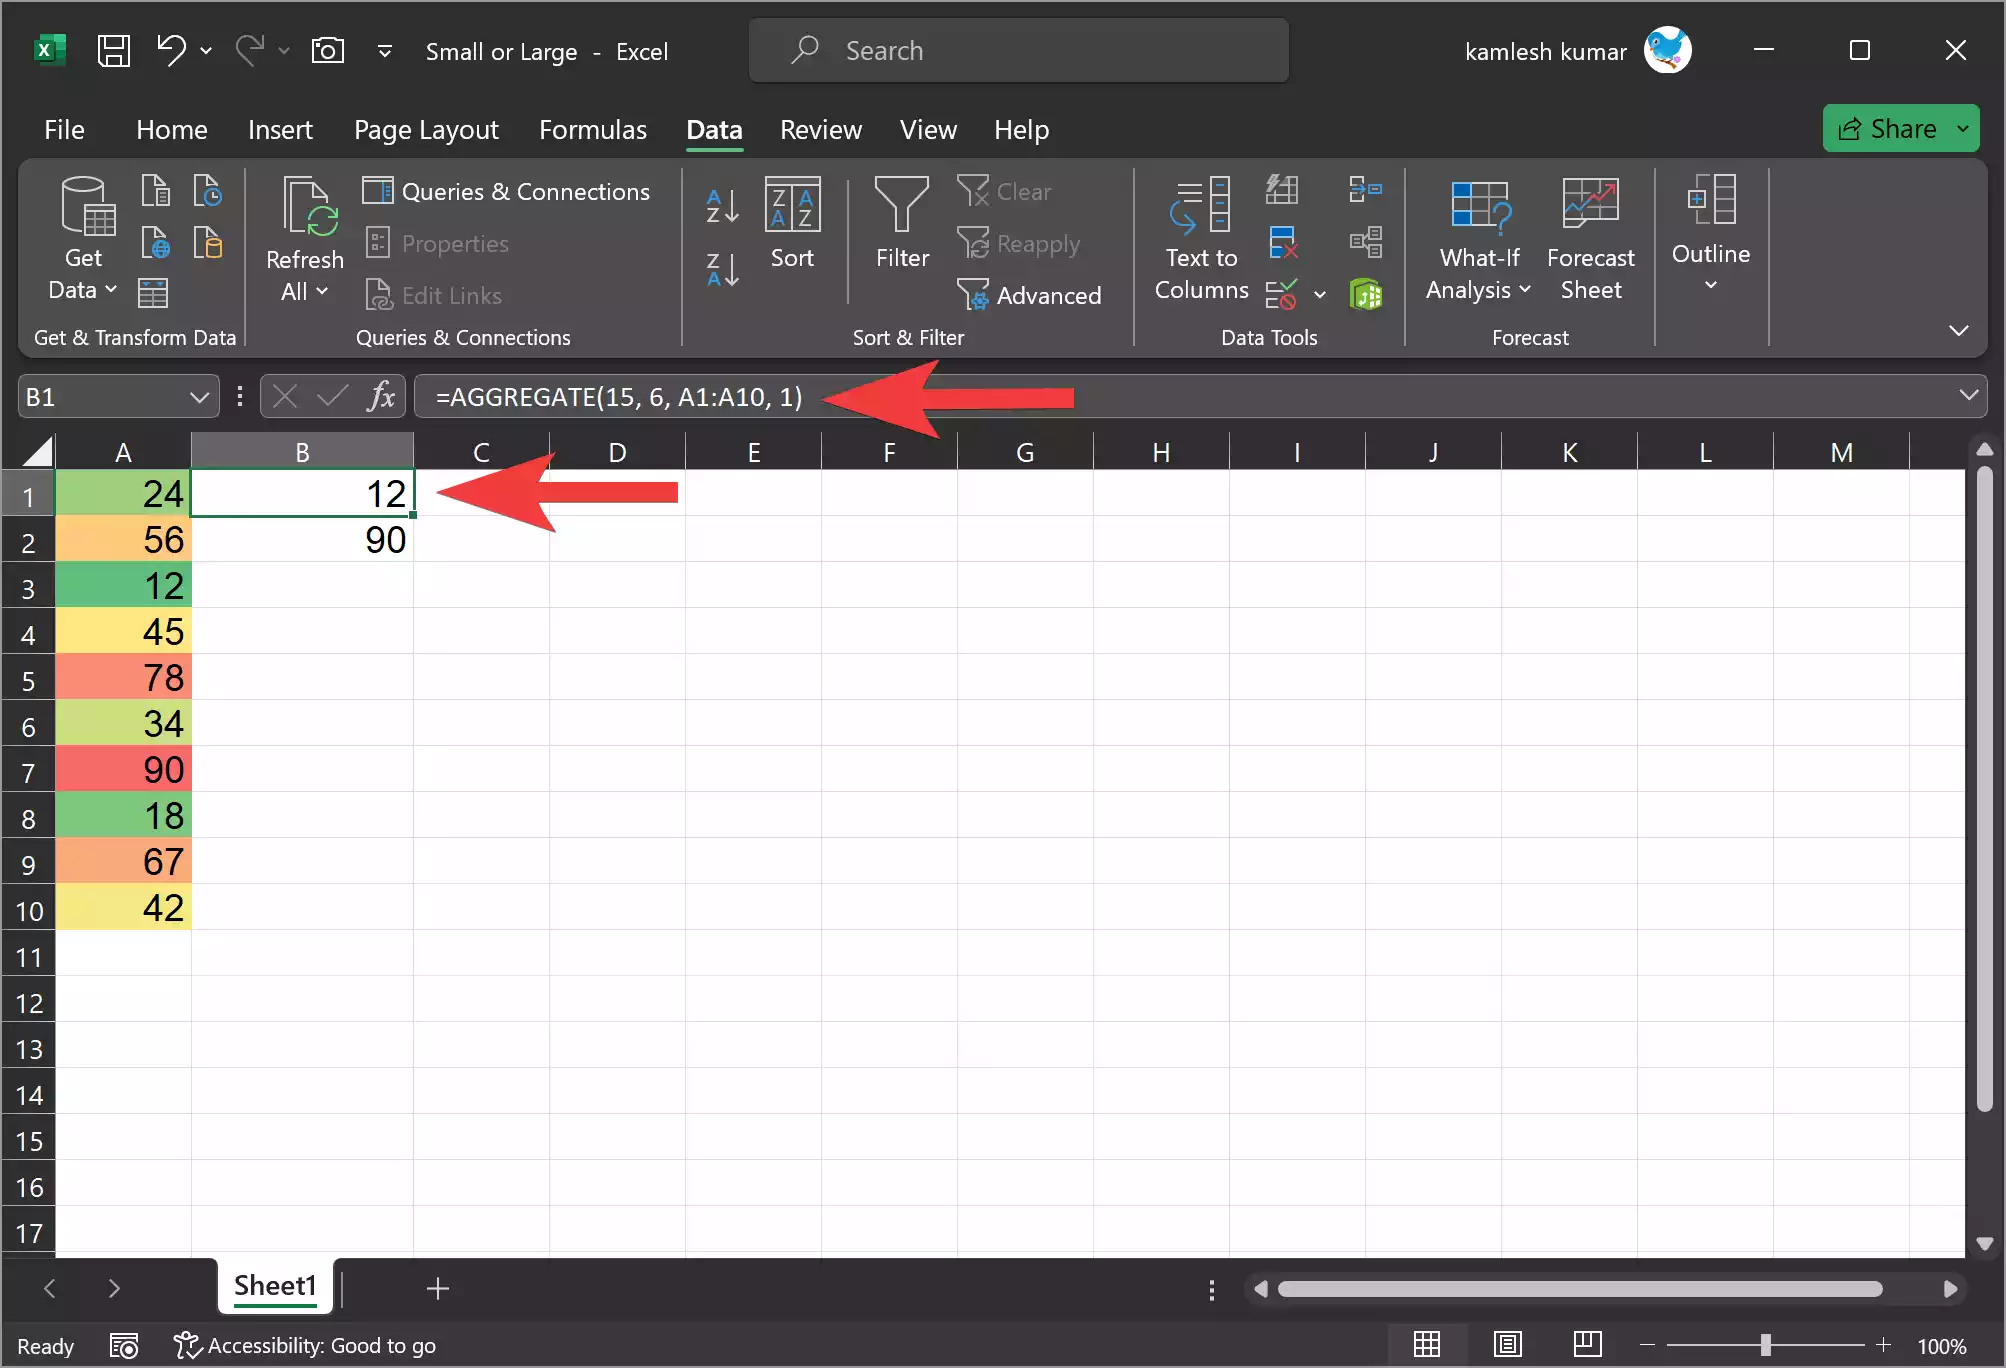
Step 1. To find the smallest number:-
=AGGREGATE(15, 6, A1:A10, 1)
The “15” specifies the SMALL function, “6” ignores errors, and “1” indicates the first smallest number.
Step 2. To find the largest number:-
=AGGREGATE(14, 6, A1:A10, 1)
The “14” specifies the LARGE function, “6” ignores errors, and “1” indicates the first largest number.
Conclusion
Microsoft Excel offers several methods for finding the smallest or largest number within a dataset, each suited to different needs and preferences. Whether you prefer a straightforward formula, visual cues through conditional formatting, or the flexibility of sorting and filtering, Excel’s versatile capabilities make data analysis a breeze. Don’t hesitate to experiment with these methods to discover which one works best for your specific Excel tasks, and you’ll be well on your way to mastering data analysis in this powerful spreadsheet tool.
