Microsoft Excel is a powerful tool for data analysis and mathematical calculations. Among its numerous built-in functions, the SQRT function stands out as a valuable tool for performing square root calculations. In this gearupwindows guide, we will explore the Excel SQRT function in detail, including its syntax, examples, and practical applications.
Understanding the SQRT Function
The SQRT function in Excel is used to calculate the square root of a number. The square root of a number is a value that, when multiplied by itself, results in the original number. This function is particularly useful when dealing with measurements, geometric calculations, or other scenarios where you need to find the length or size of a side, given an area or volume.
The syntax of the SQRT function is simple:-
=SQRT(number)
– `number`: This is the numeric value for which you want to calculate the square root.
Practical Uses of the SQRT Function
Let’s explore some practical scenarios where you can use the Excel SQRT function:-
Example 1. Finding the Length of a Side in Geometry
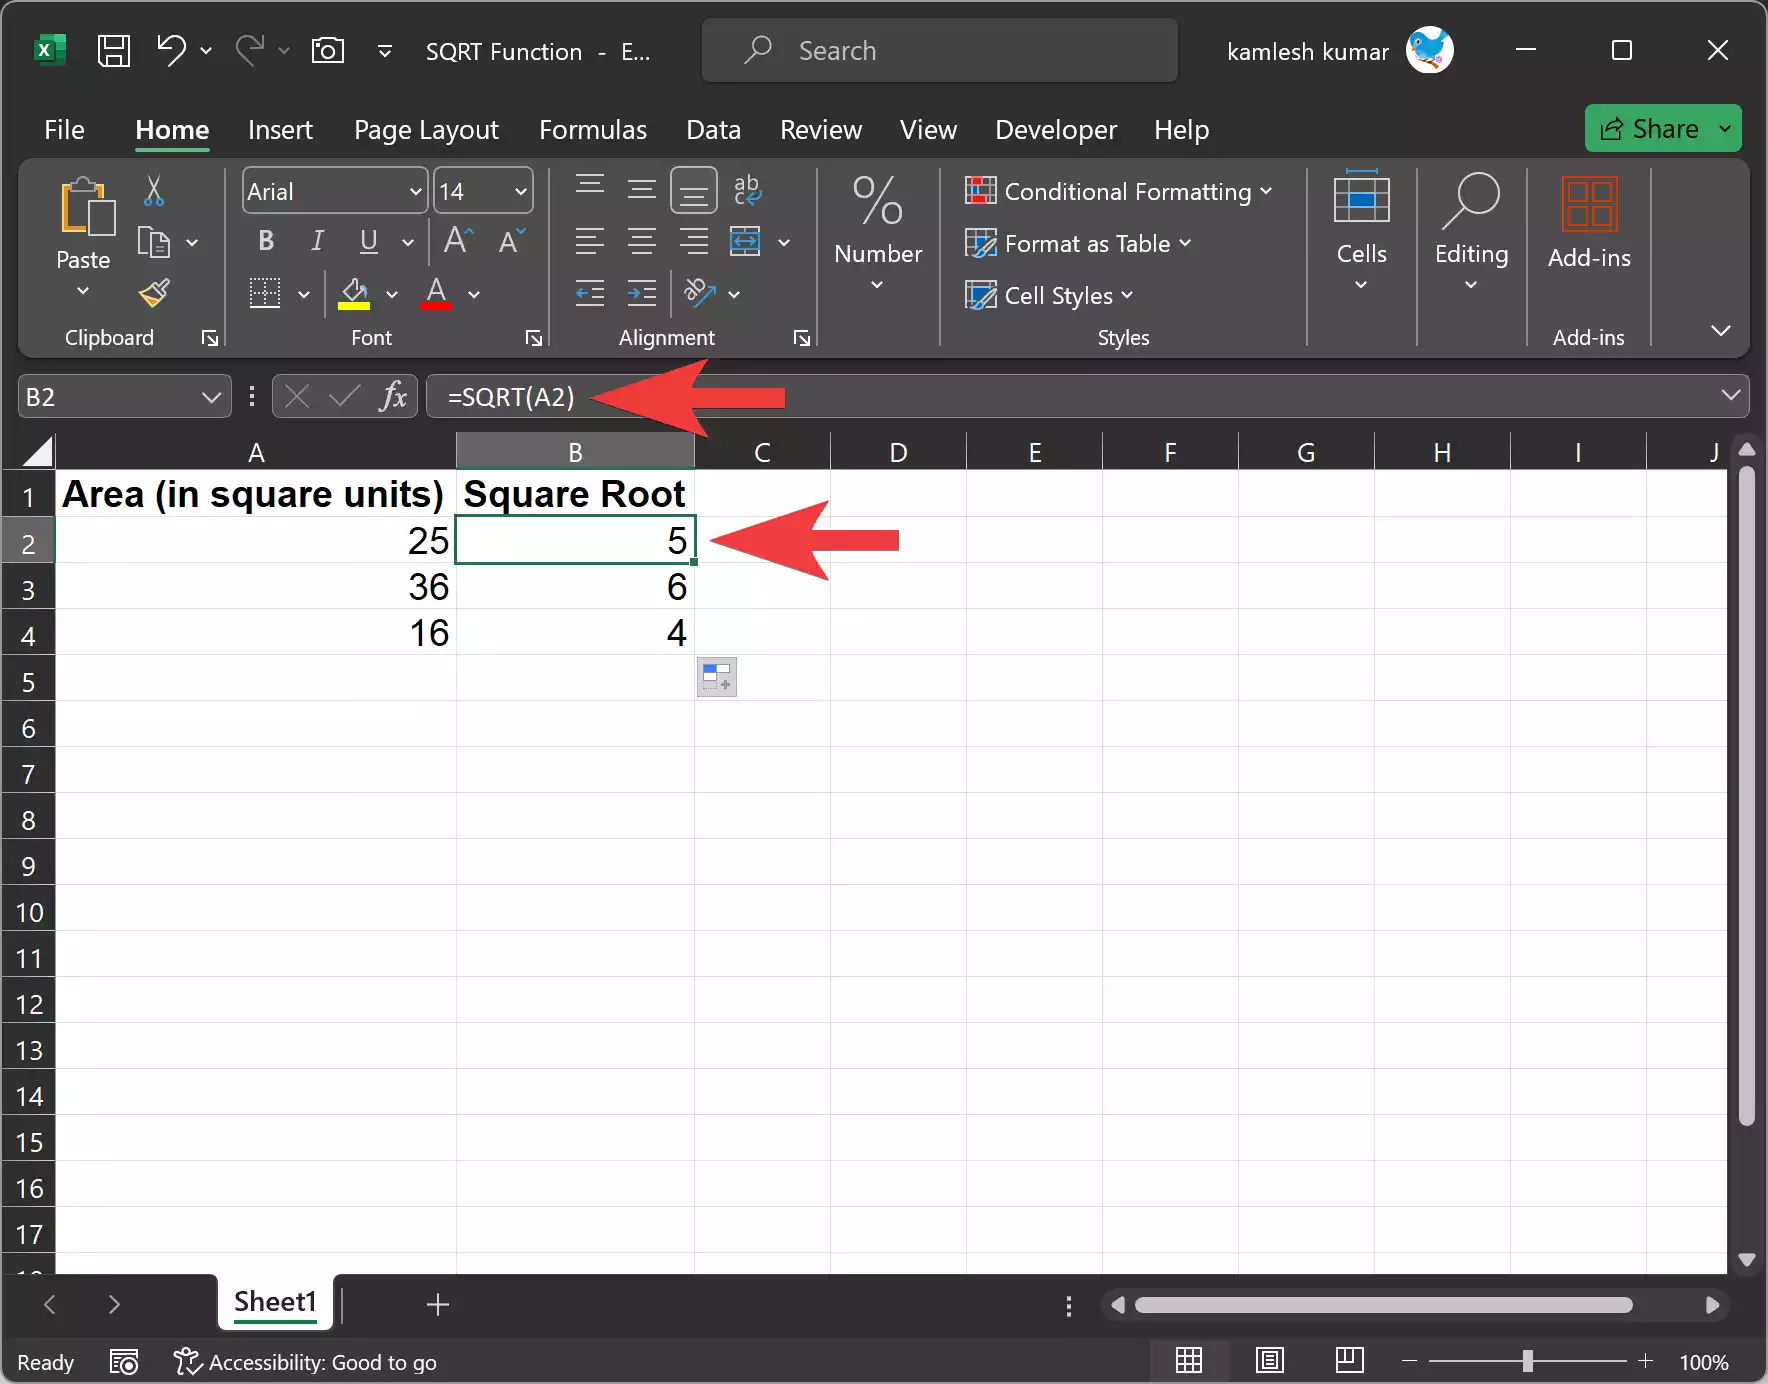
Imagine you have the area of a square and need to find the length of one of its sides. You can use the SQRT function to do this. For example:-
=SQRT(A2)
In this formula, `A2` represents the area of the square, and the SQRT function calculates the side length. Drag the fill handle down to copy the formula for all the areas in your dataset.
Example 2. Calculating the Hypotenuse in Right Triangles
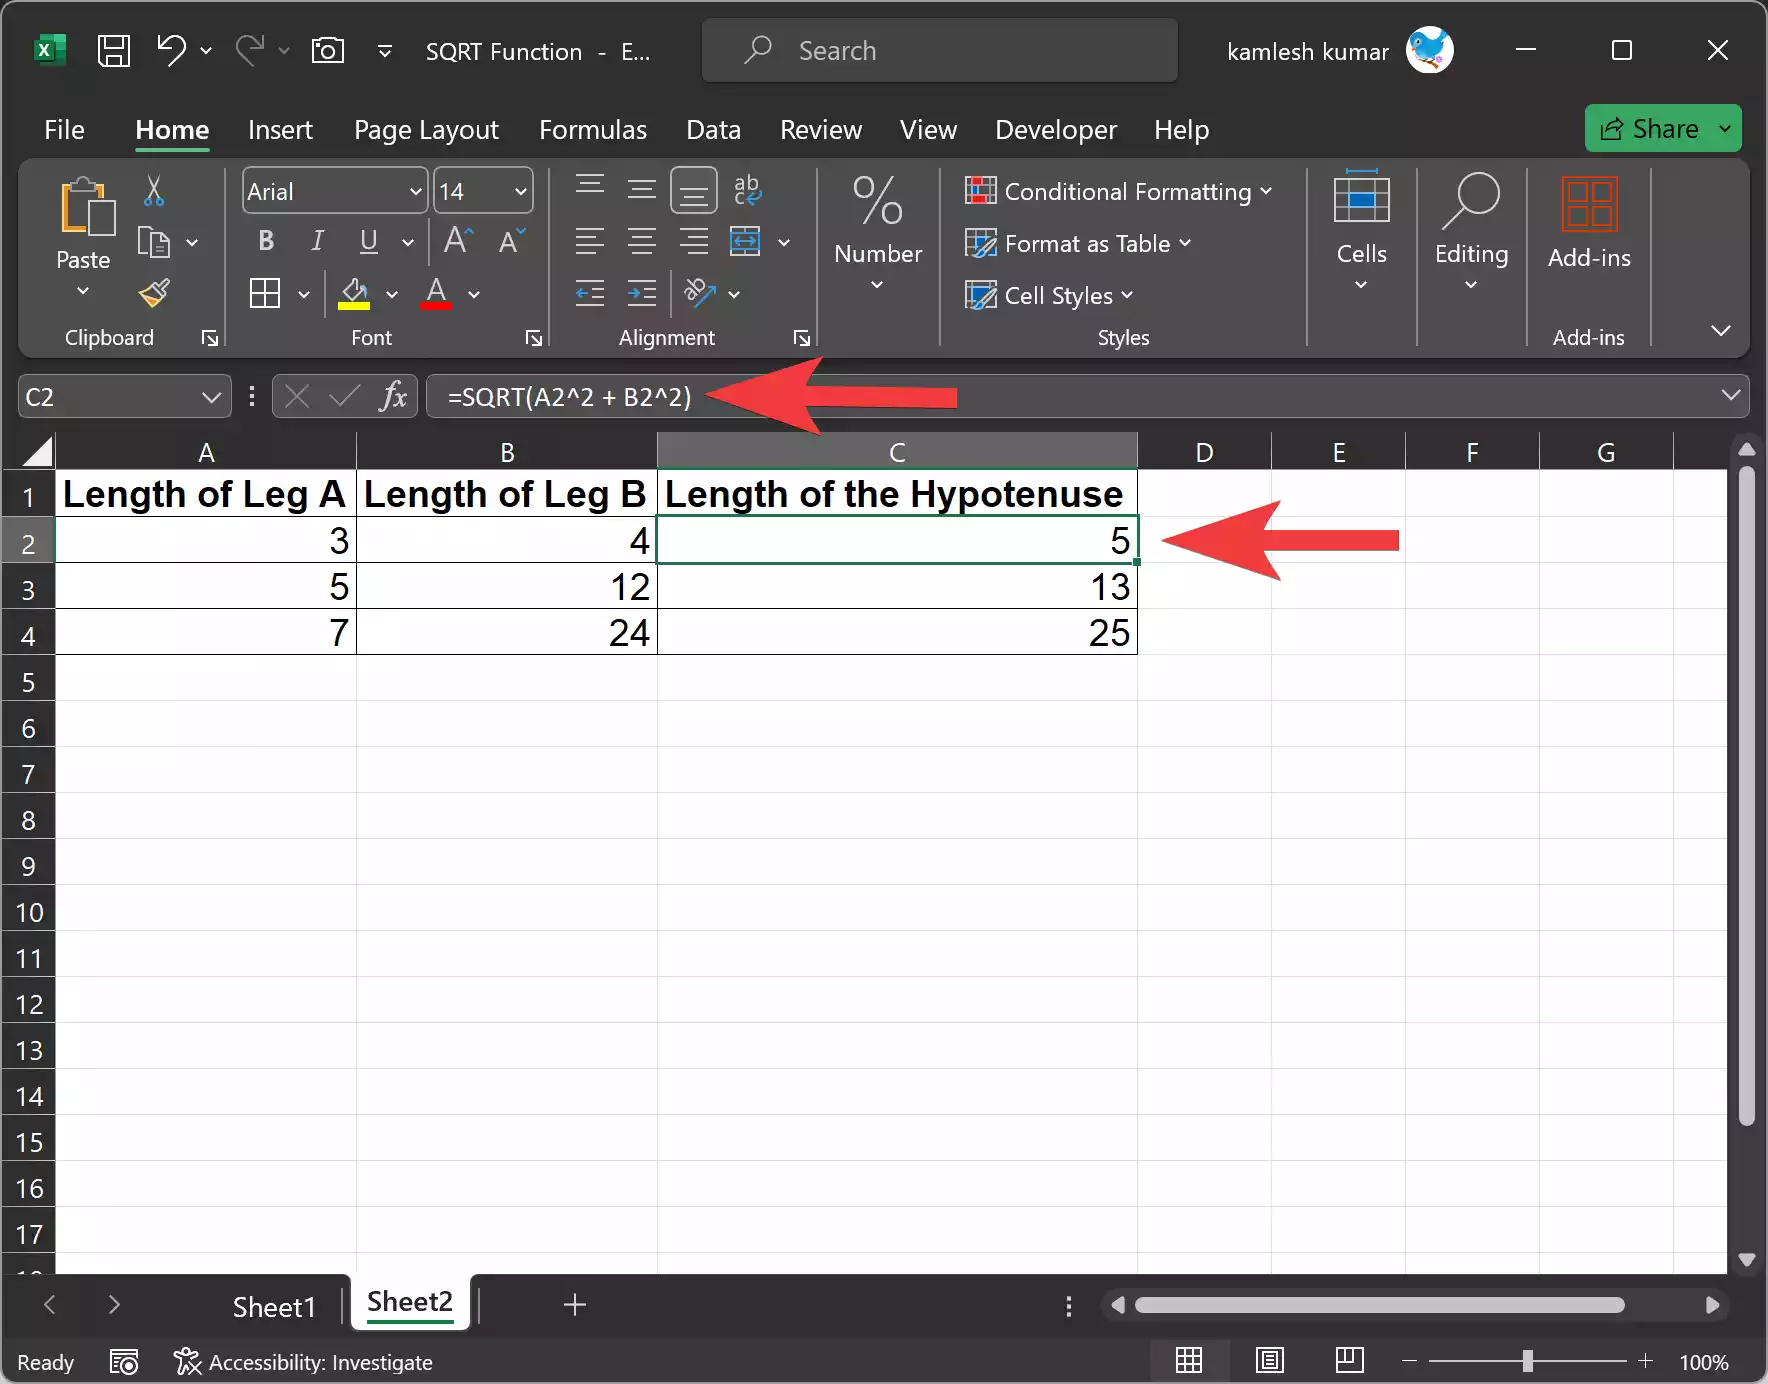
In a right triangle, you have the lengths of two sides (legs), and you want to find the length of the hypotenuse. The Pythagorean theorem states that the square of the hypotenuse is equal to the sum of the squares of the other two sides. Using the SQRT function, you can find the hypotenuse length:-
=SQRT(A2^2 + B2^2)
In this formula, `A2` and `B2` represent the lengths of the legs, and the SQRT function calculates the length of the hypotenuse.
Example 3. Calculating Standard Deviation
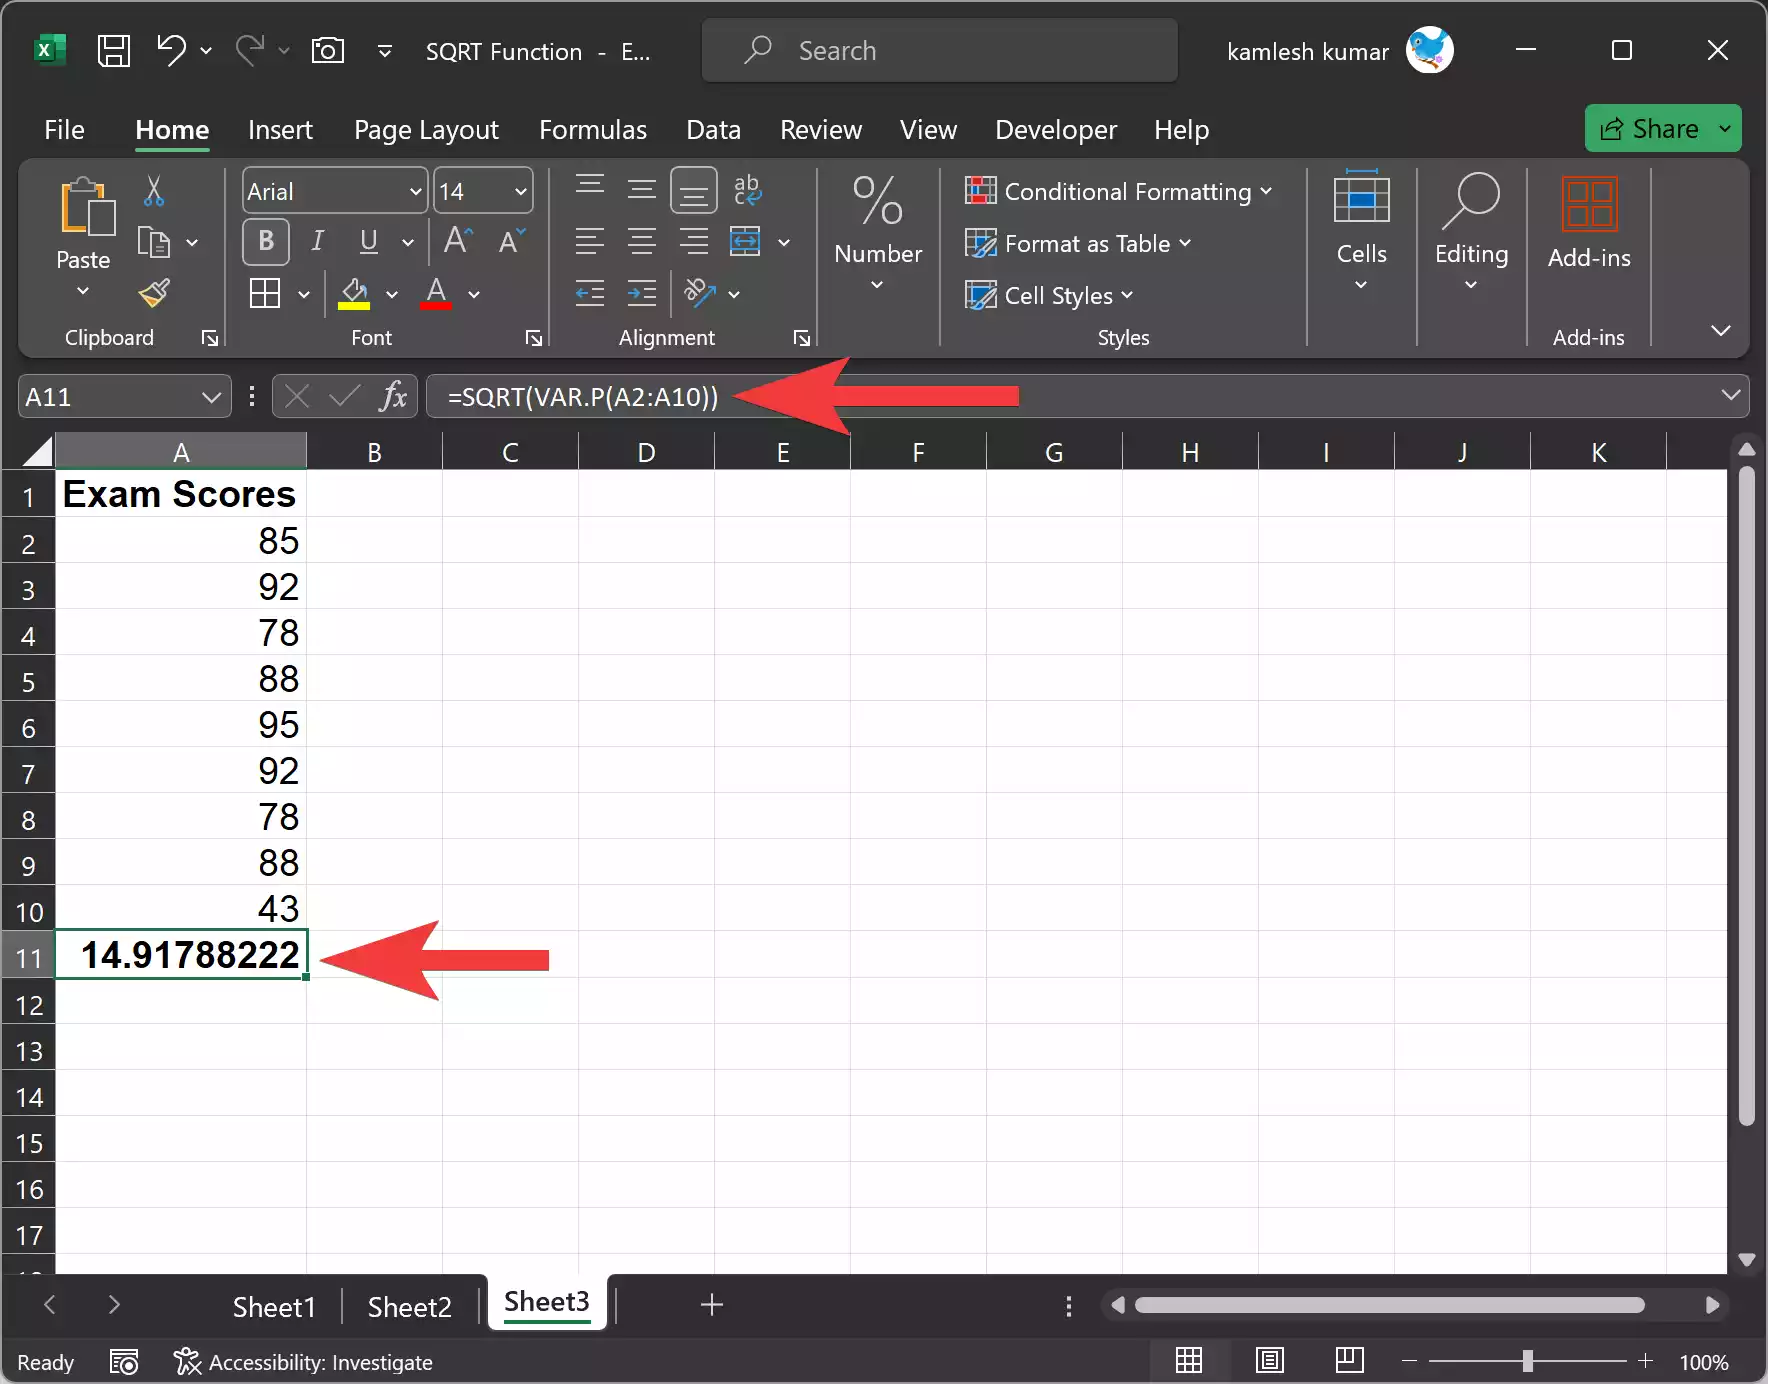
In statistics, the standard deviation measures the amount of variation or dispersion in a dataset. One way to calculate it is to find the square root of the variance. Excel’s SQRT function can help you find the standard deviation for a dataset:-
=SQRT(VAR.P(A2:A10))
In this formula, `A2:A10` represents your dataset, and the VAR.P function calculates the population variance, which is then used to find the standard deviation.
Example 4. Determining the Radius of a Circle
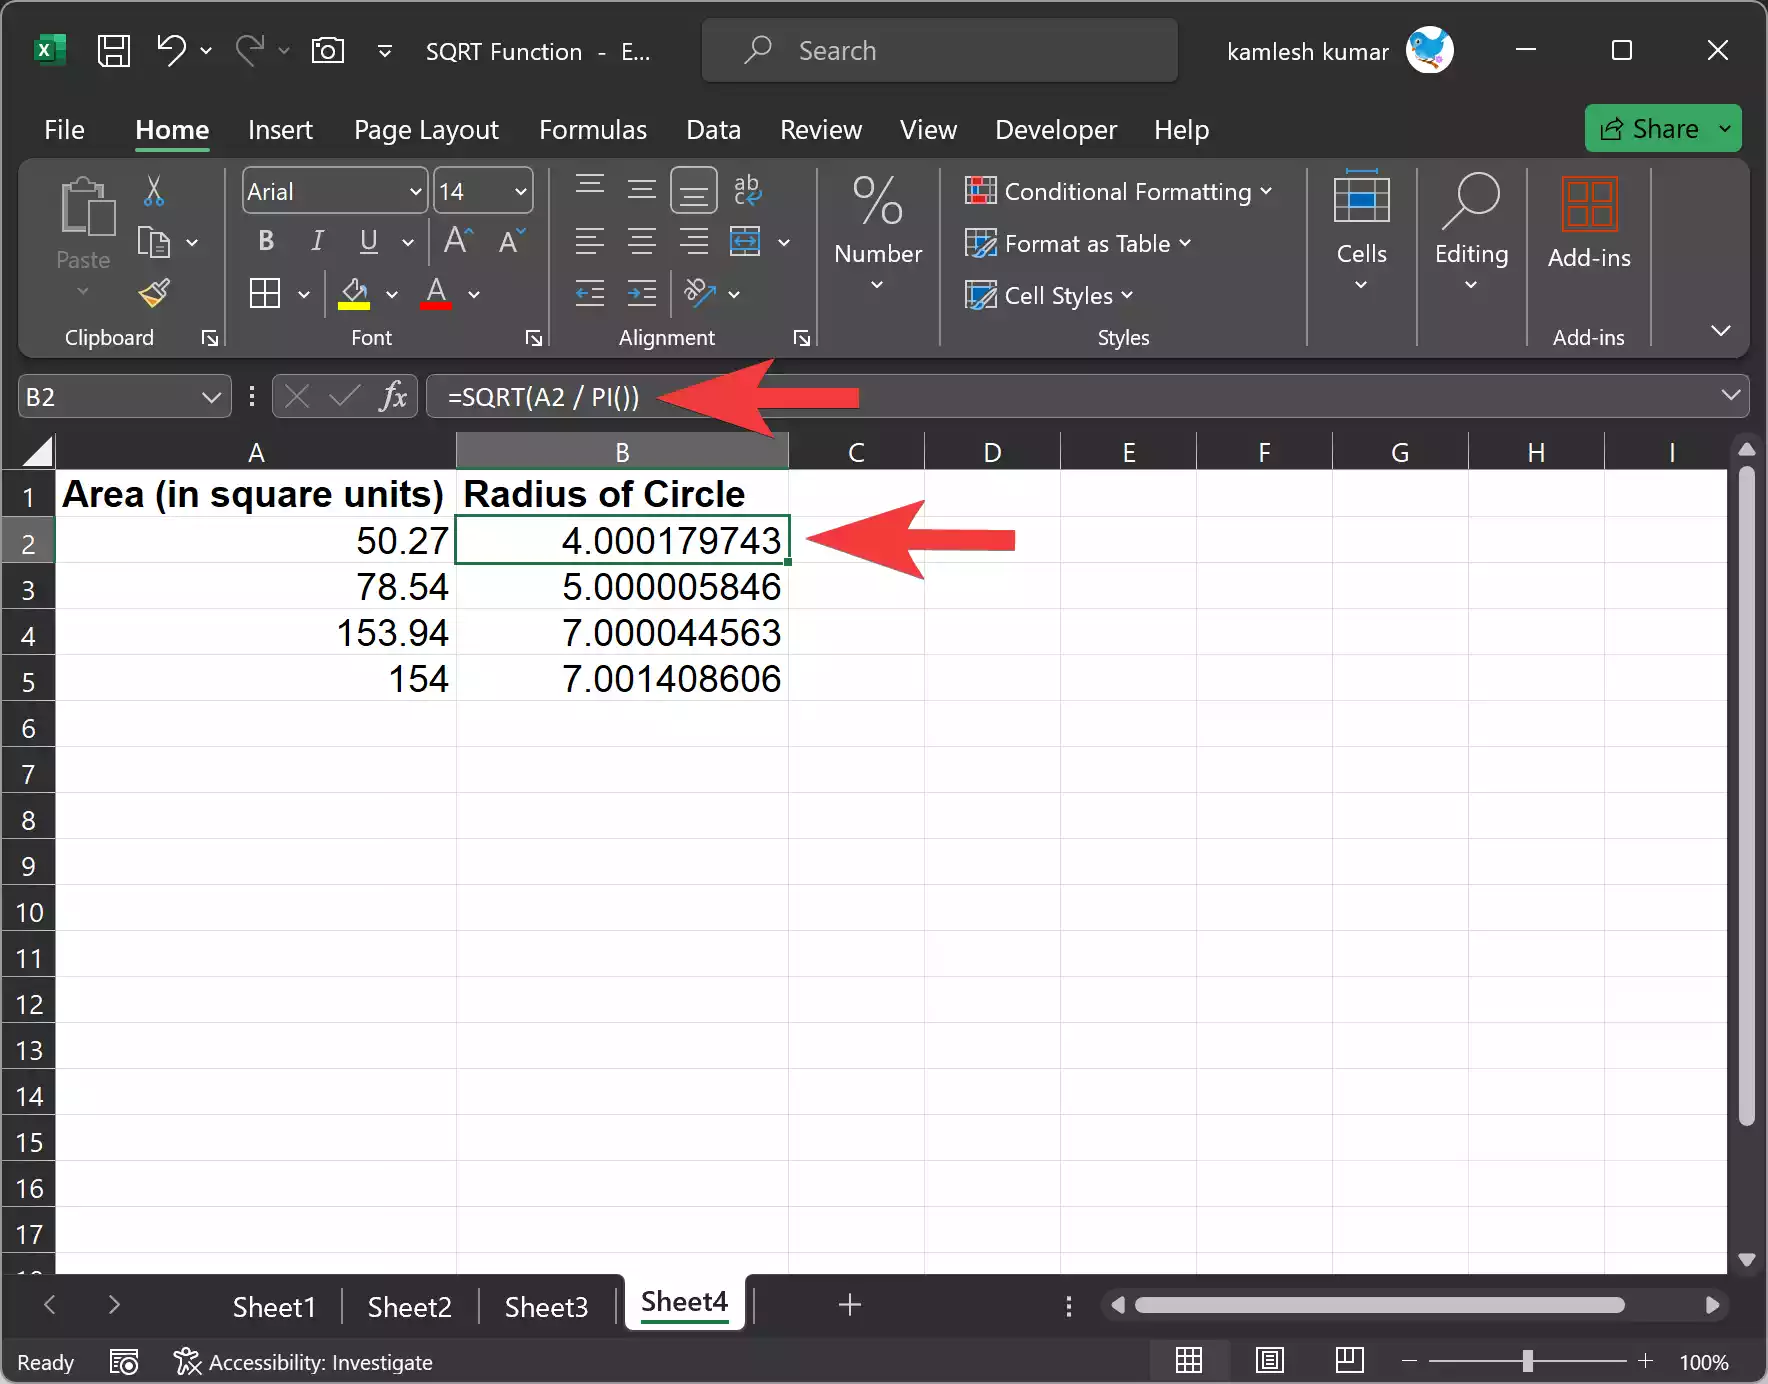
Suppose you have the area of a circle, and you want to find its radius. You can use the SQRT function as follows:-
=SQRT(A2 / PI())
In this formula, `A2` represents the area of the circle, and the SQRT function calculates the radius. The `PI()` function provides the value of pi.
Wrapping Up
The Excel SQRT function is a versatile tool for performing square root calculations in various fields, from geometry to statistics. By understanding its syntax and practical applications, you can enhance your data analysis and mathematical modeling capabilities in Excel.
Next time you encounter scenarios where square root calculations are needed, remember the SQRT function and its ability to simplify complex mathematical operations. Excel’s built-in functions, including SQRT, can save you time and effort when working with numeric data and performing calculations in your spreadsheets.