Microsoft Excel is a powerful spreadsheet software that offers a wide range of features for organizing and analyzing data. One useful feature is the ability to group rows, which allows you to collapse or expand sections of your spreadsheet, making it easier to navigate and work with large sets of data. This gearupwindows article will guide you through the process of grouping rows in Microsoft Excel.
Must Read: How to Group Columns in Microsoft Excel?
Why Group Rows?
Grouping rows in Excel serves several purposes:-
1. Data Organization: Grouping rows can help you organize your data by categorizing it into sections, making it easier to understand and work with.
2. Data Presentation: When you have a large dataset, you can use row grouping to present a summary view of your data, showing only the most important information.
3. Improved Readability: Grouped rows make your spreadsheet more readable, especially when you need to focus on specific sections while temporarily hiding others.
4. Reduced Scrolling: Grouping rows allows you to collapse sections of your data, reducing the need to scroll through long spreadsheets.
Now, let’s dive into the step-by-step process of grouping rows in Excel.
How to Group Rows in Microsoft Excel?
Follow these steps to Group Rows in Microsoft Excel:-
Step 1. Start by opening your Excel spreadsheet and locating the rows that you want to group. Ensure that you have the data well-organized in a way that you can easily define the groups you want to create.
Step 2. To select the rows that you want to group, click and drag your mouse over the row numbers on the left side of the spreadsheet. These are the row headers, and selecting them will highlight the rows you want to group. Alternatively, you can hold down the “Shift” key while clicking on the row numbers to select multiple rows.
Step 3. Once you’ve selected the rows, click on the “Data” tab. Under the “Outline” group, use the drop-down menu “Group” and select the “Group” option.

Step 4. Excel will automatically group the selected rows. You’ll notice a small button with a minus sign (–) or a plus sign (+) to the left of the row numbers that indicate grouped rows.

By default, Excel will group the rows and collapse them, so you’ll only see the row numbers of the grouped section.
Step 5. To expand or collapse the grouped rows, simply click on the plus sign (+) or minus sign (–) button next to the row numbers. Clicking the plus sign will expand the group, revealing the rows within, while clicking the minus sign will collapse the group, hiding the rows.
Step 6. Don’t forget to save your workbook after grouping rows to ensure that your changes are preserved.
How to Ungroup Rows in Microsoft Excel?
Ungrouping rows in Microsoft Excel is a straightforward process that allows you to remove the grouping structure applied to a set of rows. Here are the steps to ungroup rows in Excel:-
Step 1. Begin by opening the Excel spreadsheet that contains the grouped rows you want to ungroup. Make sure the spreadsheet is in the view that you want to work with, as the ungrouping process will affect the current display.
Step 2. Identify the grouped rows that you wish to ungroup. These rows should have a small button with a minus sign (–) or a plus sign (+) to the left of the row numbers, indicating they are currently grouped.
Step 3. To ungroup the rows, you first need to select the entire group. To do this, click on any of the row numbers within the grouped section. This will select the entire group.
Alternatively, you can click and drag your mouse over the row numbers in the grouped section to select multiple rows at once.
Step 4. Once the grouped rows are selected, to ungroup them, go to the “Data” tab, click on the “Ungroup” drop-down menu under the “Outline” group, and choose “Ungroup.”
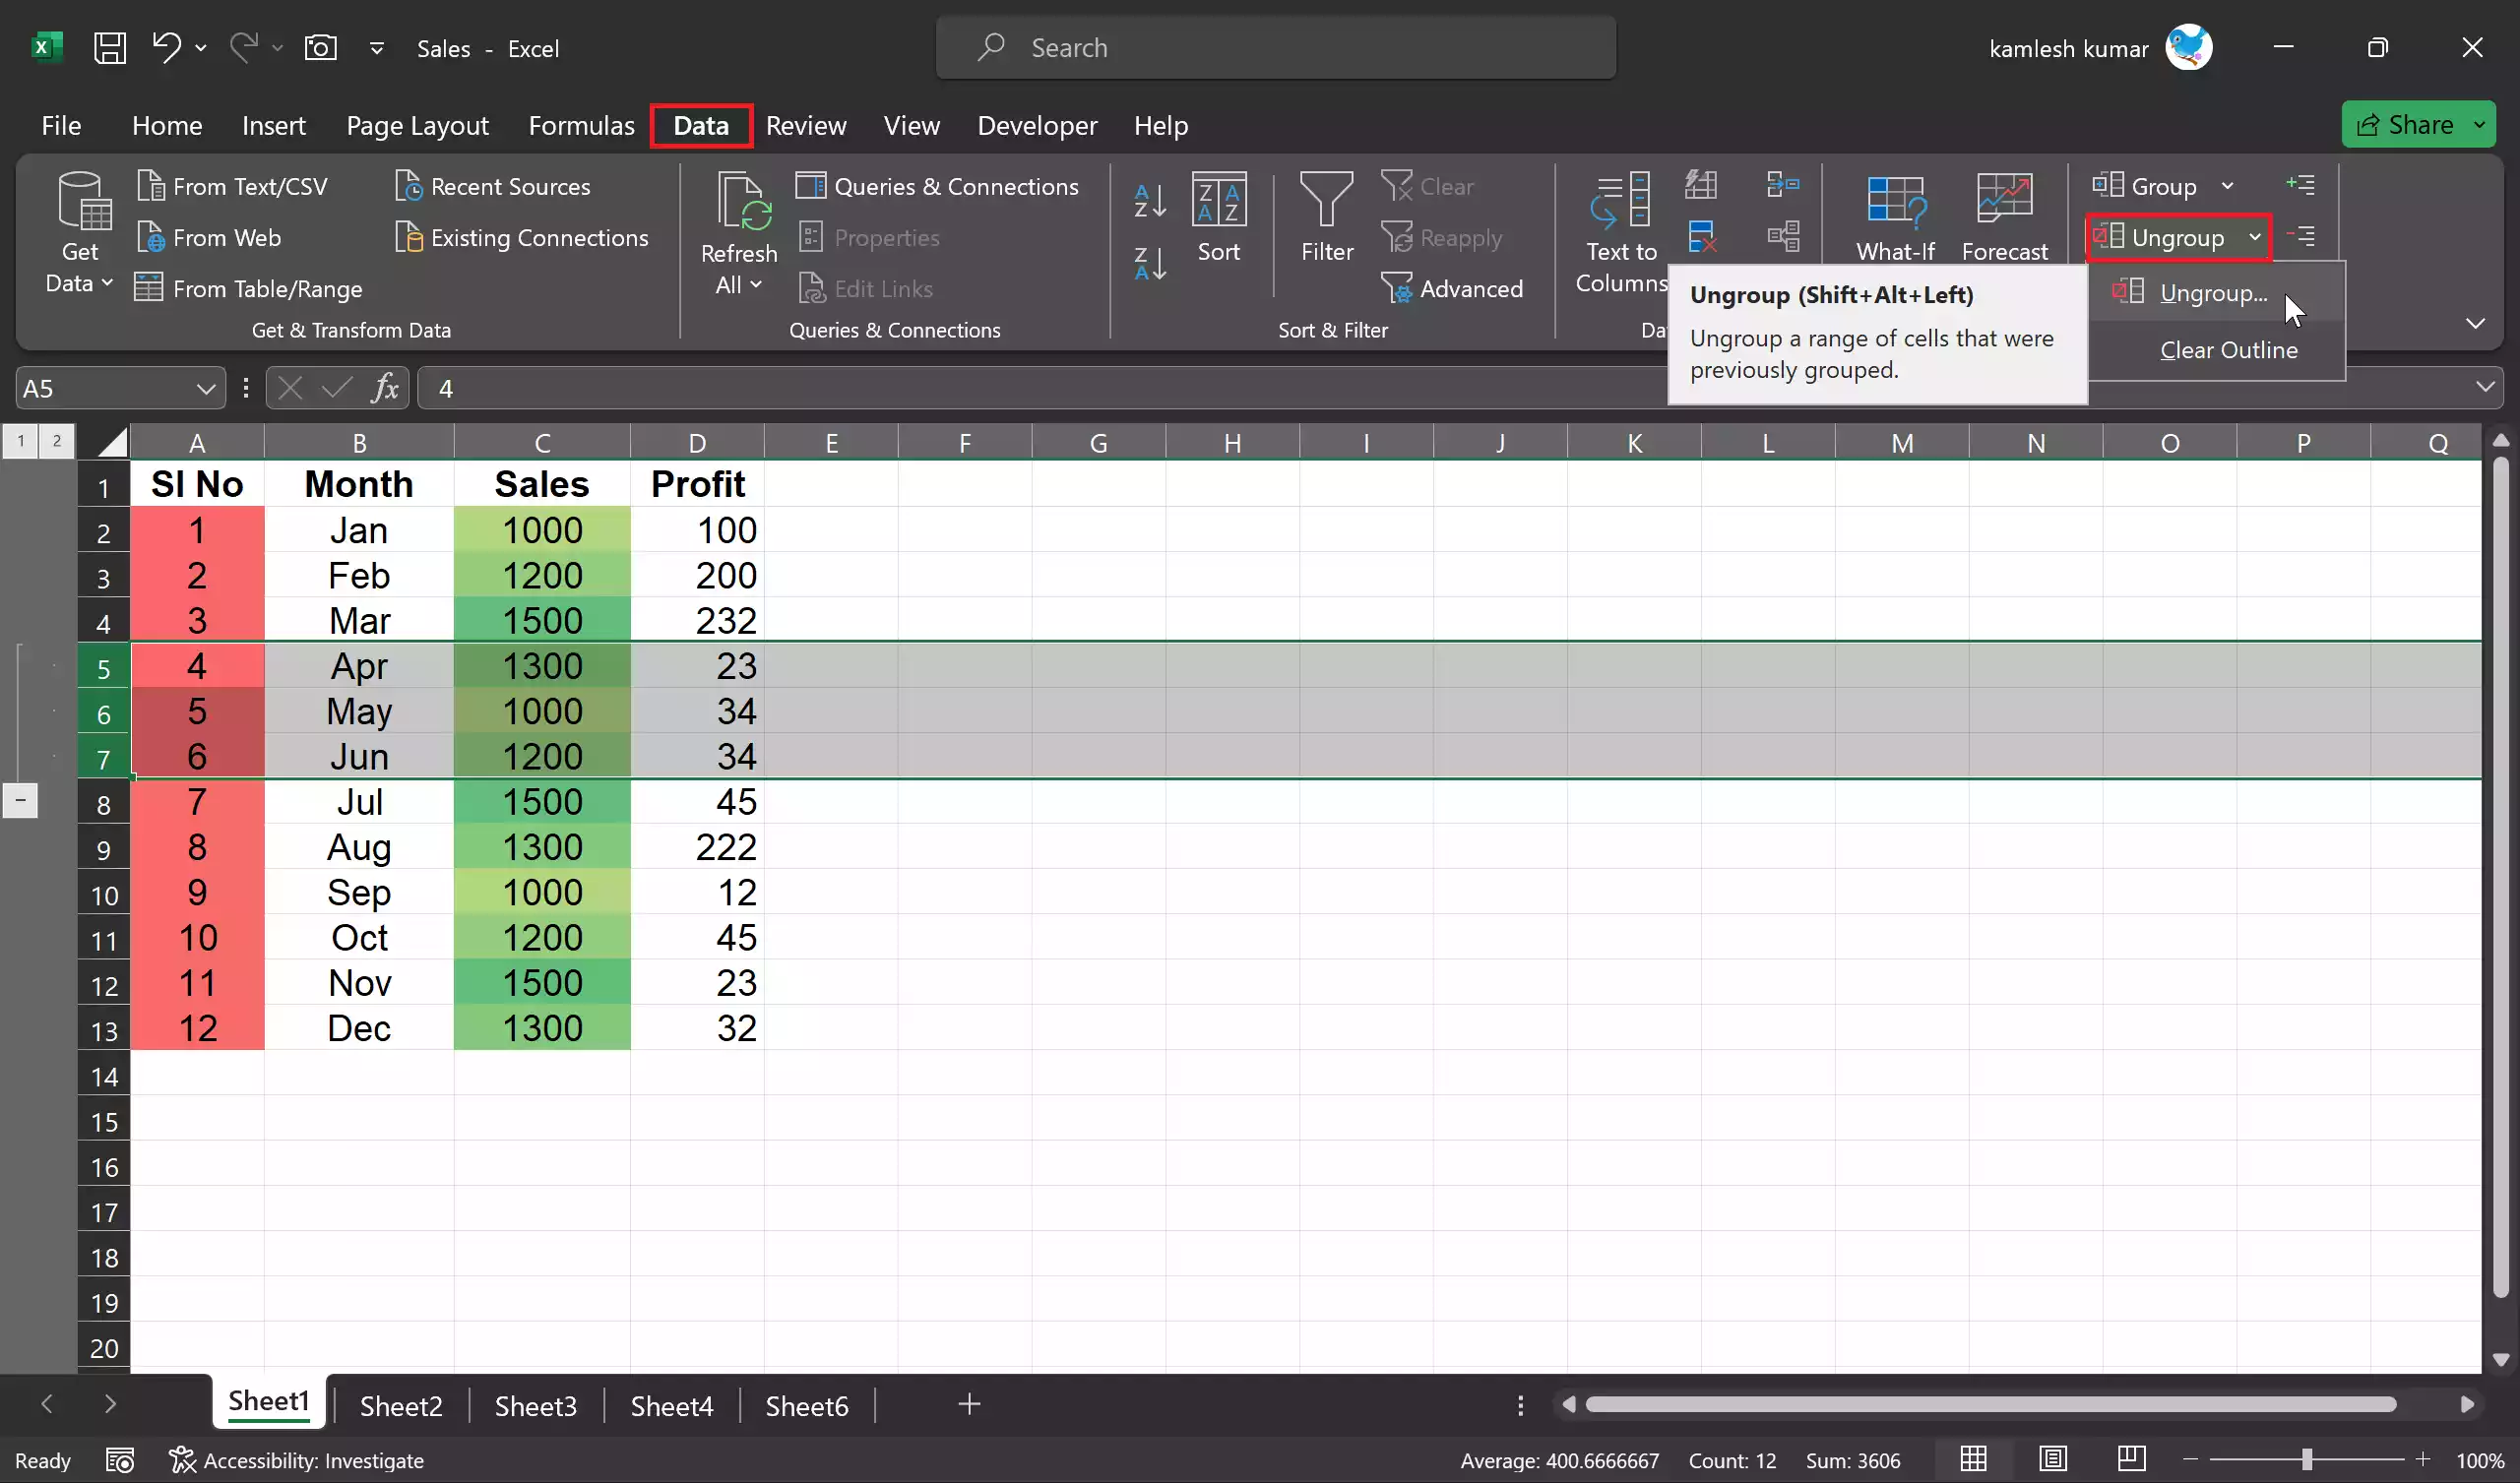
Excel will immediately remove the grouping structure from the selected rows. You will no longer see the plus sign (+) or minus sign (–) buttons next to the row numbers, indicating that the rows are no longer grouped.
Step 5. To ensure that the rows have been successfully ungrouped, check that you can now see all the individual row numbers within the formerly grouped section. If you can see the row numbers and there are no plus or minus signs, it confirms that the rows are ungrouped.
Step 6. After ungrouping the rows, it’s a good practice to save your Excel workbook to preserve the changes you’ve made.
That’s it! You’ve successfully ungrouped rows in Microsoft Excel. This process allows you to remove grouping structures when they are no longer needed, giving you more control over your spreadsheet’s layout and presentation.
Conclusion
In conclusion, grouping rows in Microsoft Excel is a powerful feature that helps you organize and present your data more effectively. Whether you’re working with large datasets or creating summary reports, grouping rows can make your spreadsheet easier to navigate and understand. By following the steps outlined in this article, you’ll be able to master this feature and improve your Excel skills.
