Microsoft Excel is a versatile spreadsheet software that offers a wide range of functions to help users manipulate and analyze data effectively. One such function is ABS, which stands for “absolute.” The ABS function is a mathematical function that can be incredibly useful for various tasks in Excel. In this gearupwindows article, we will explore what the ABS function is, its syntax, and several practical use cases to help you understand how to use it effectively.
Understanding the ABS Function
The ABS function in Excel is a mathematical function that returns the absolute value of a number. The absolute value of a number is its distance from zero on the number line, regardless of whether it’s positive or negative. In other words, it removes the negative sign from a negative number, making it positive.
The syntax of the ABS function is straightforward:-
=ABS(number)
– `number`: This is the numeric value for which you want to find the absolute value.
Practical Uses of the ABS Function
Let’s explore some practical scenarios where you can use the ABS function in Excel:-
1. Calculating the Magnitude of Deviations: Suppose you have a dataset that contains both positive and negative deviations from a target value. You want to find the magnitude of these deviations to understand the overall impact. You can use the ABS function to do this. For example:-
=ABS(B2 - A2)
In this formula, `A2` represents the target value, and `B2` represents the actual value. The ABS function calculates the absolute difference, giving you the magnitude of the deviation.
2. Summing Positive Values Only: If you have a list of values and you want to find the sum of only the positive values, you can use the ABS function in conjunction with the SUMIF function. For instance:-
=SUMIF(A1:A10, ">0")
In this example, the ABS function is not used directly, but it’s implied by the condition. The SUMIF function sums values in the range `A1:A10` that are greater than zero.
3. Creating a Progress Chart:Suppose you’re tracking progress towards a goal. You can use the ABS function to create a chart that displays only positive progress values, even if there are negative setbacks. This can make your chart more visually appealing and informative.
By applying the ABS function to your progress data, you can create a column or chart that always moves in a positive direction.
Example 1: Calculating the Magnitude of Deviations
Suppose you have a dataset that contains actual sales figures (in column B) and target sales figures (in column A). You want to find the magnitude of the deviations to understand the overall impact. You can use the ABS function to do this. Here’s how:
Step 1. In cell C2, enter the following formula:-
=ABS(B2 - A2)
This formula calculates the absolute difference between the actual and target sales, which gives you the magnitude of the deviation.

Step 2. Drag the fill handle (a small square at the bottom-right corner of the cell) down to copy the formula for all the rows in the dataset.
Now, column C contains the absolute deviations, which indicate the magnitude of the differences between actual and target sales.
Example 2: Summing Positive Values Only
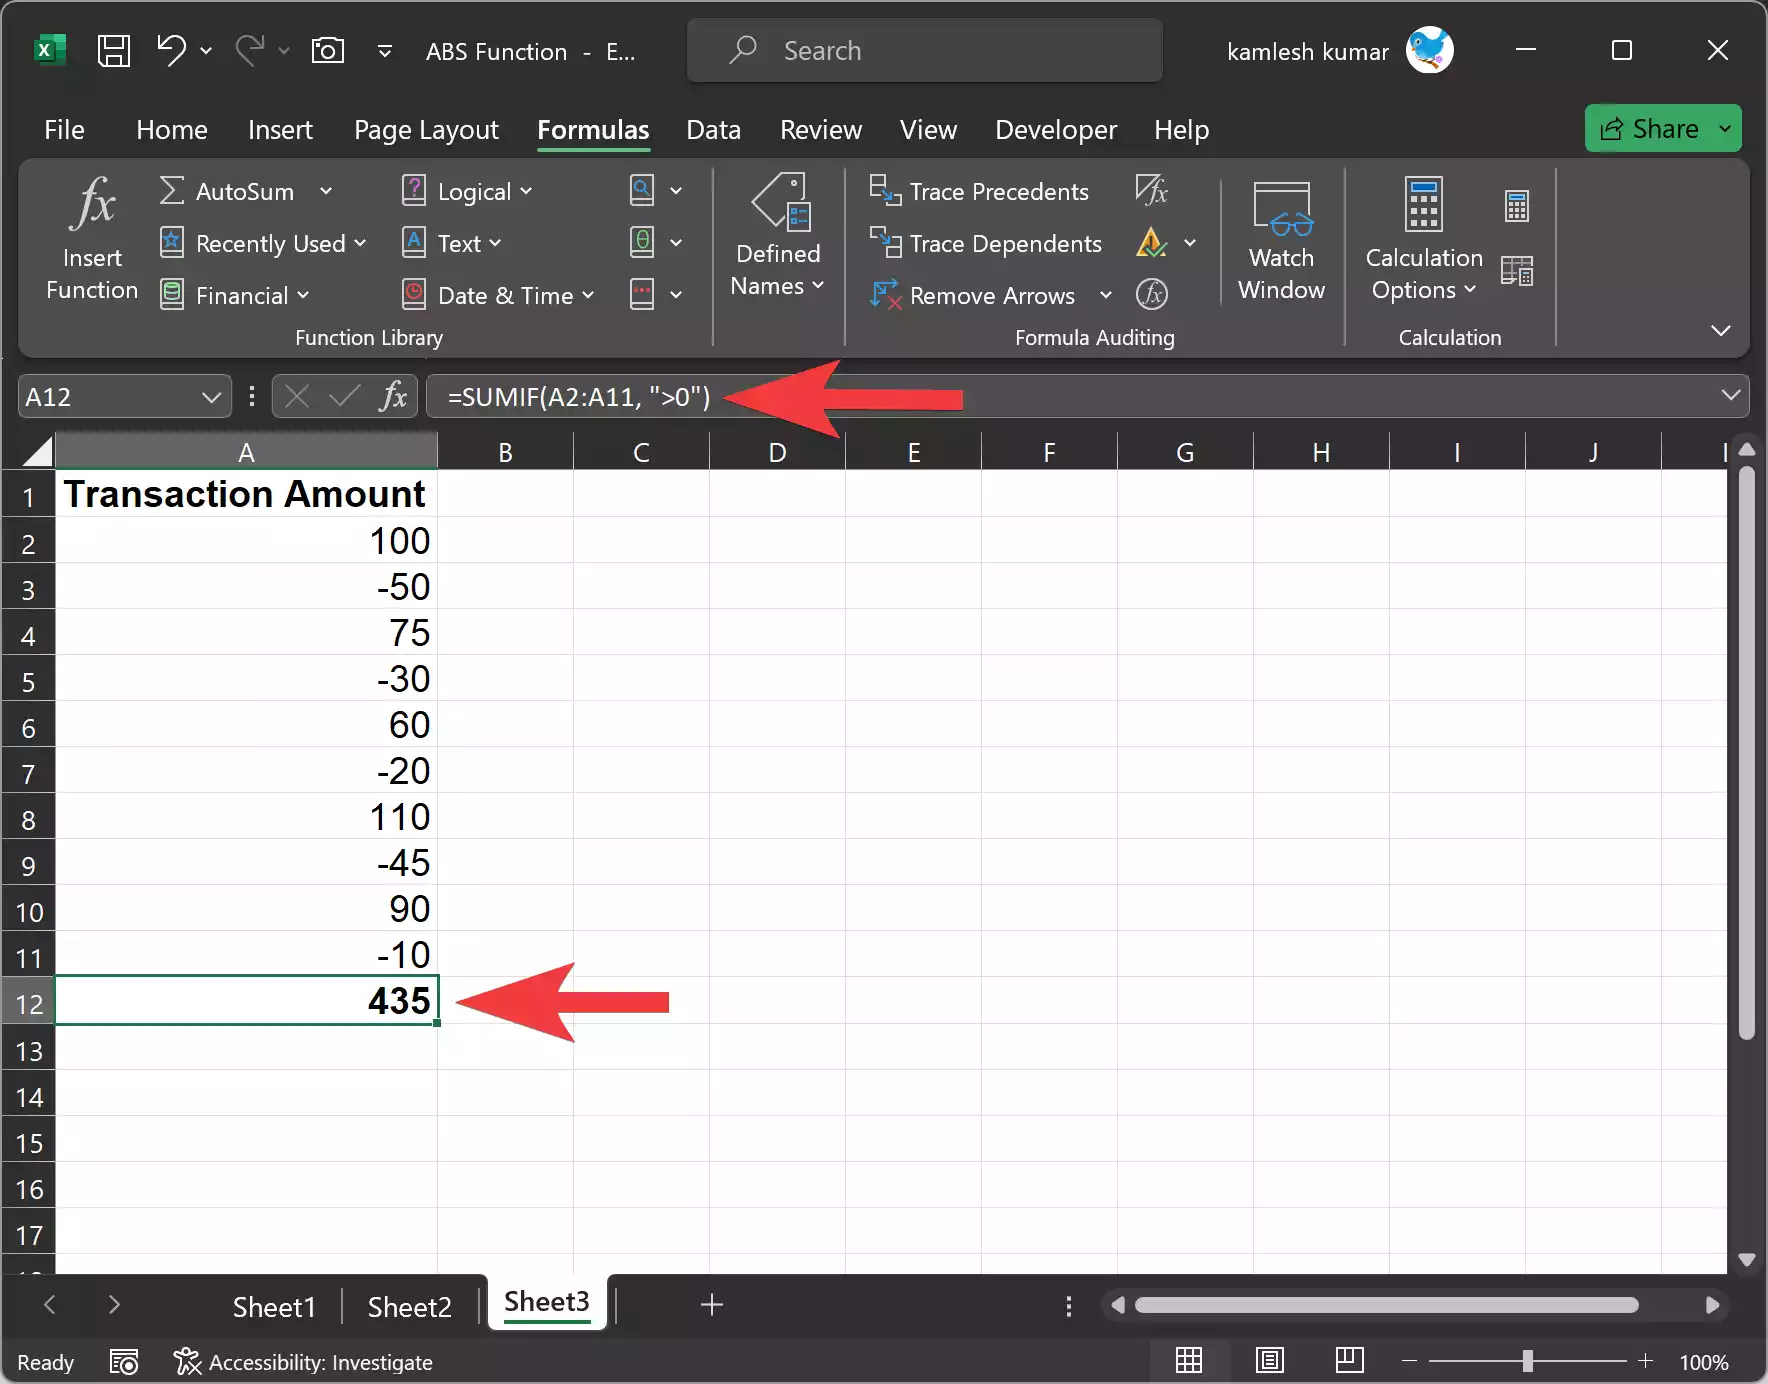
Let’s say you have a list of financial transactions in column A, including both deposits and withdrawals. You want to find the total of all deposits (positive values) using the ABS function and SUMIF.
Step 1. In an empty cell, you can use the following formula:-
=SUMIF(A2:A11, ">0")
This formula uses the SUMIF function to sum values in the range A2:A11 that are greater than zero. It effectively sums only the positive values.
Example 3: Creating a Progress Chart
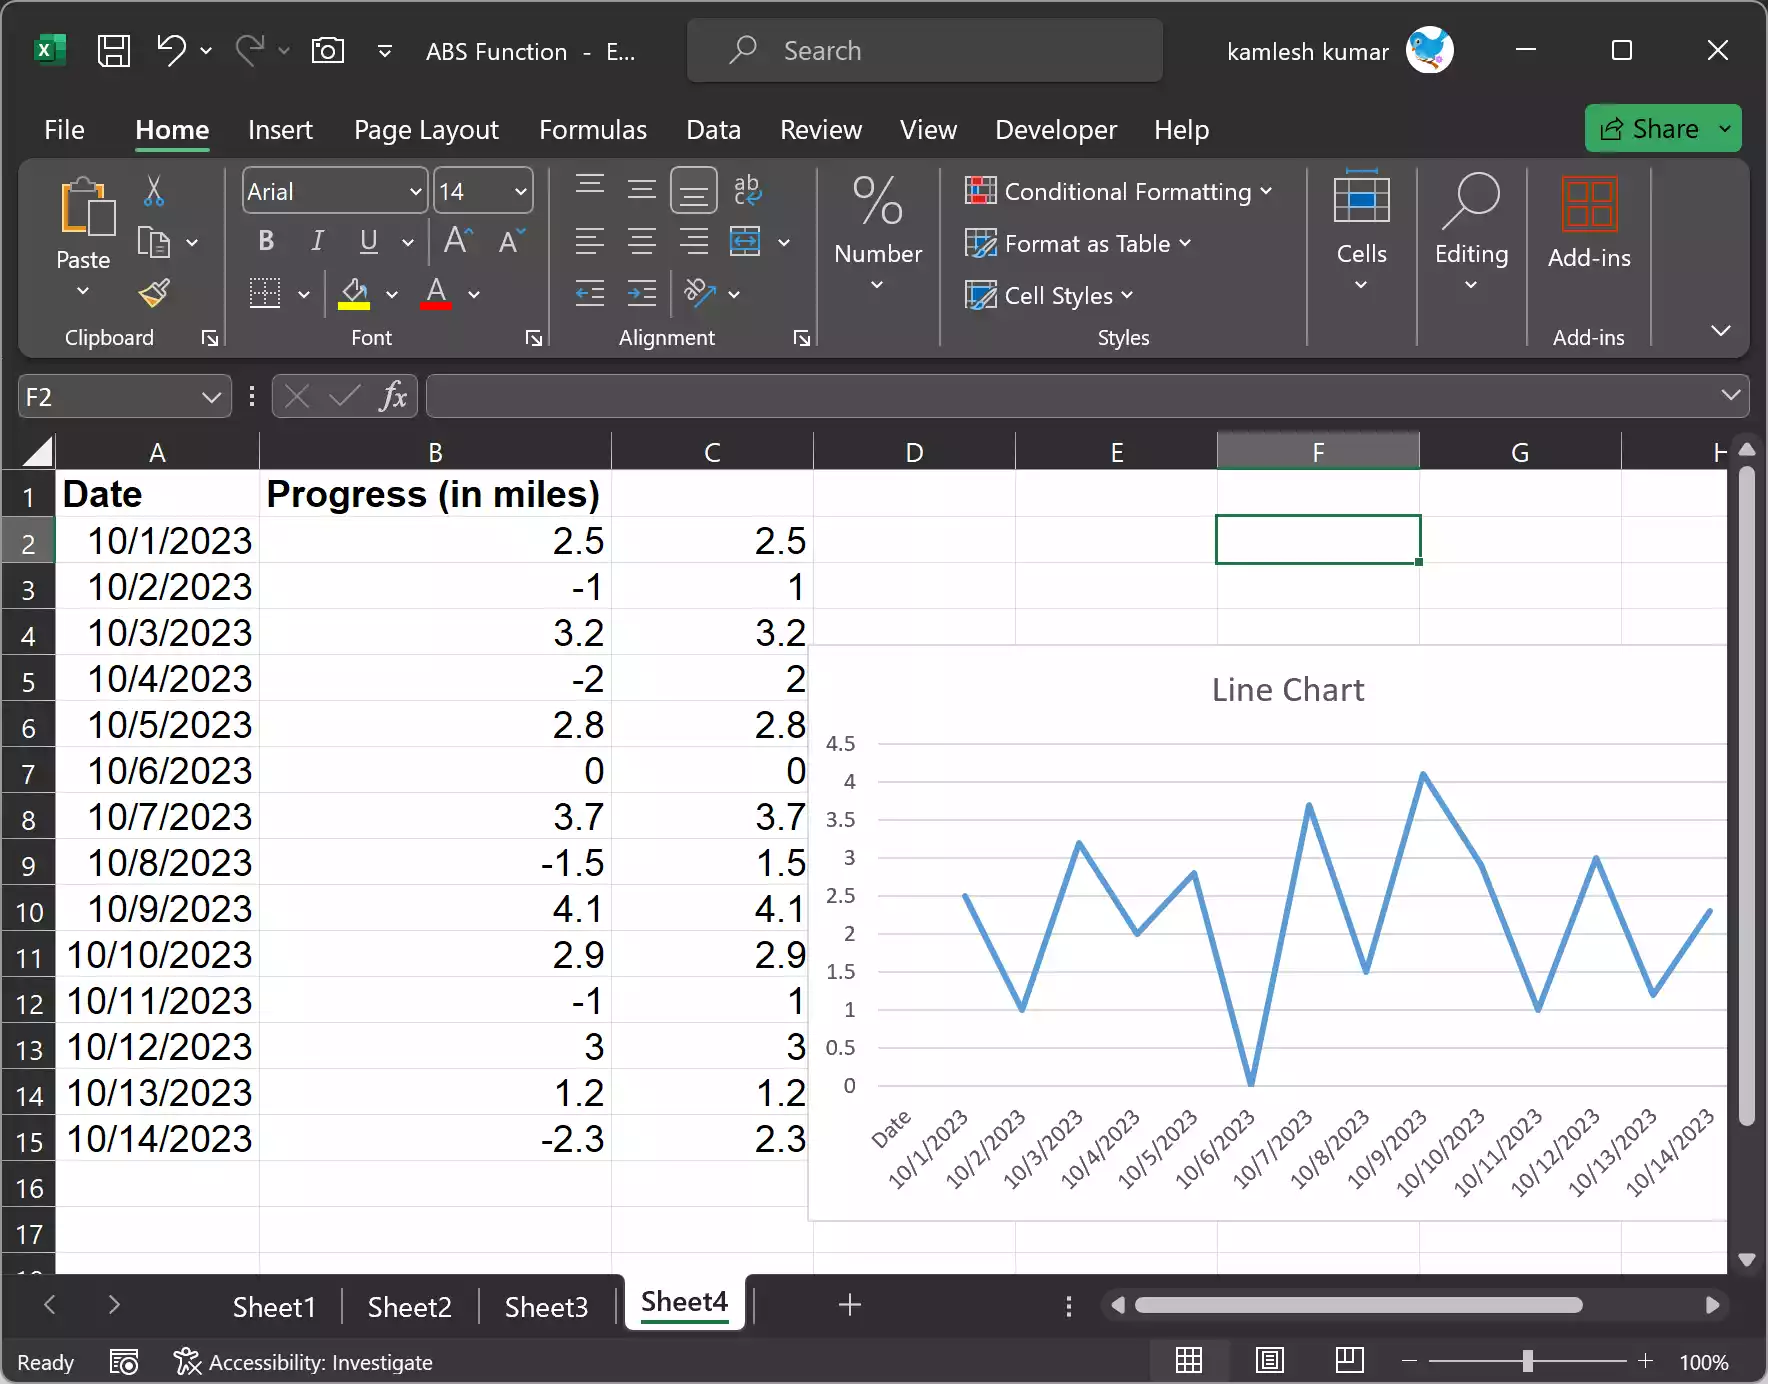
Suppose you’re tracking progress towards a fitness goal, and you want to create a chart that displays only positive progress values, even if there are setbacks. Here’s how you can use the ABS function to do this:-
Step 1. Create a table with columns for dates and progress values, where negative values indicate setbacks and positive values represent progress.
Step 2. In a new column, apply the ABS function to your progress data. For example, if your progress data is in column B, enter the following formula in the new column (let’s say column C):
=ABS(B2)
This formula calculates the absolute value of the progress.
Step 3. Create a line chart using the date column as the x-axis and the absolute progress values (column C) as the y-axis. This chart will always move in a positive direction, regardless of setbacks.
Wrapping Up
The ABS function in Excel is a powerful tool that helps you work with both positive and negative numbers effectively. It is versatile and can be used in various scenarios, from simple mathematical operations to chart creation.
By understanding the concept and syntax of the ABS function and practicing its application in different situations, you can enhance your data analysis and presentation skills in Excel. So, the next time you need to work with absolute values in your spreadsheets, remember the ABS function and how it can simplify your tasks and improve your data handling in Microsoft Excel.