Embedding an Excel chart into a Word document is an excellent way to visually represent data and enhance the clarity and impact of your documents. Whether you’re creating reports, presentations, or other documents, integrating charts can make your information more accessible and engaging. In this article, we’ll provide you with a detailed, step-by-step guide on how to embed or insert an Excel chart into a Word document.
How to Embed an Excel Chart in a Word Document?
To embed or insert an Excel Chart in a Word Document, follow these steps:-
Step 1. Before you can embed an Excel chart into your Word document, you need to create the chart in Excel first. So, launch Microsoft Excel on your computer.
Step 2. Enter or import your data into an Excel worksheet.
Step 3. Select the data you want to use for your chart.
Step 4. Go to the “Insert” tab in the Excel ribbon.
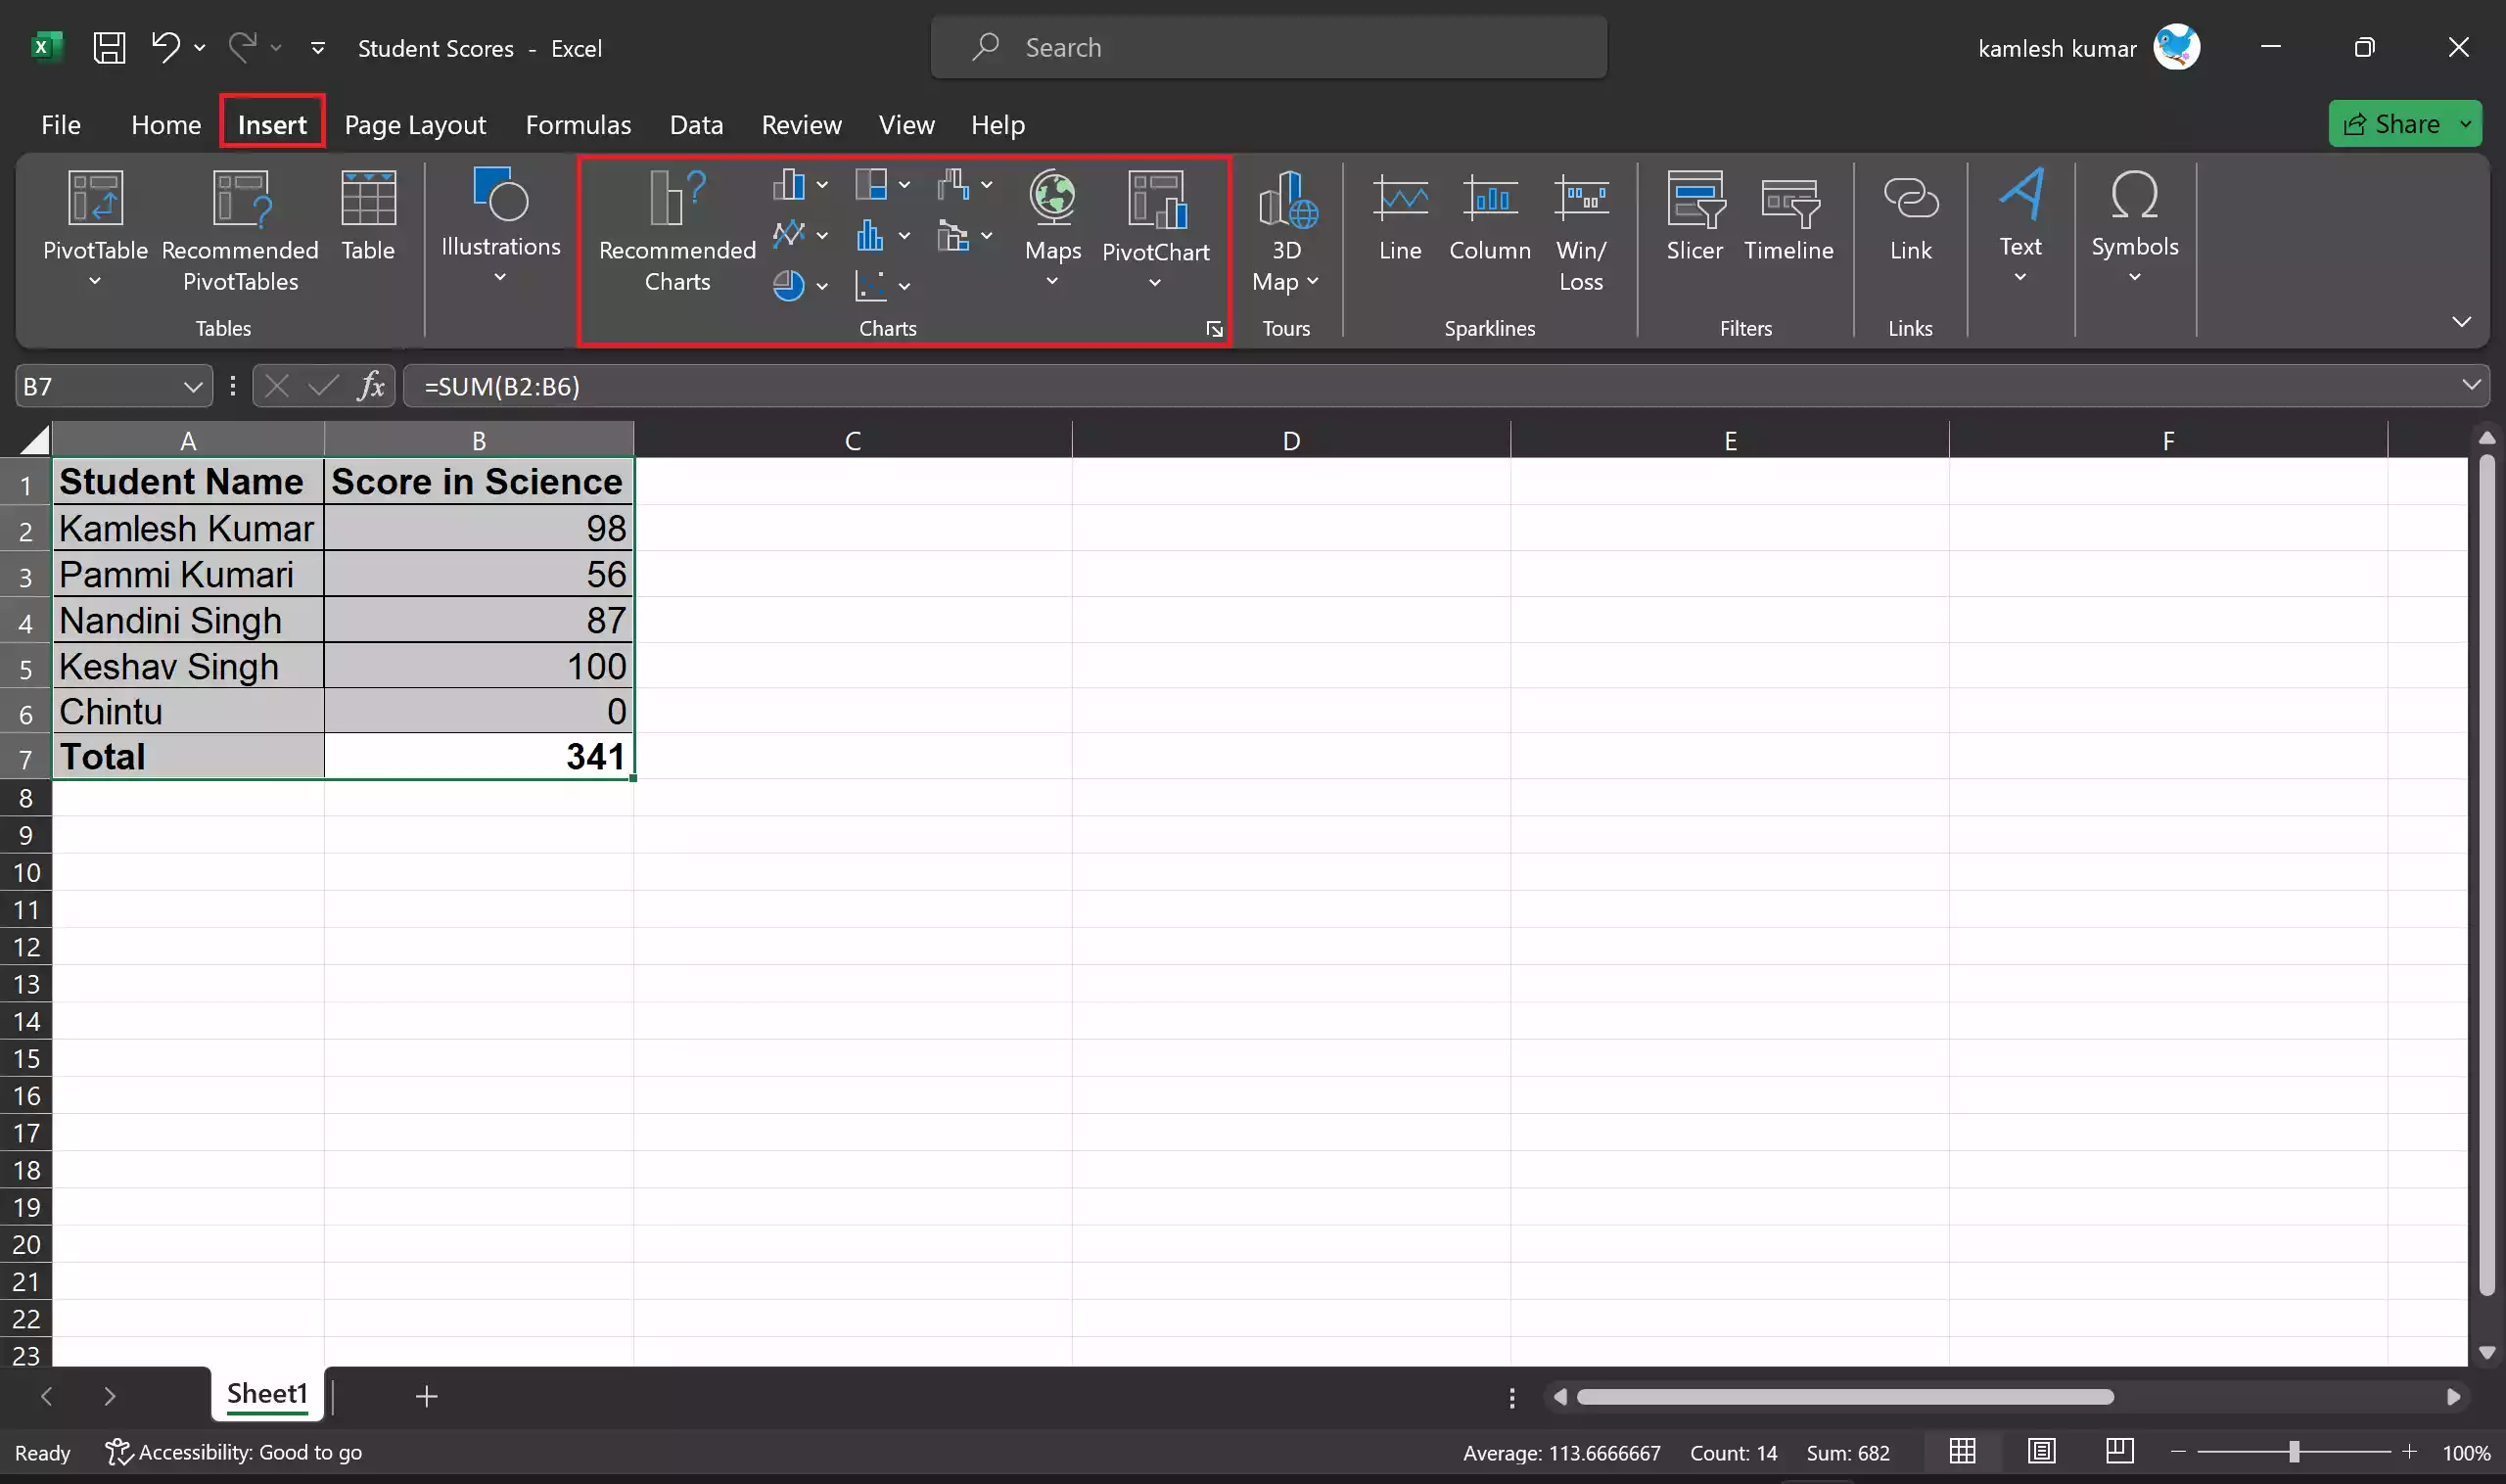
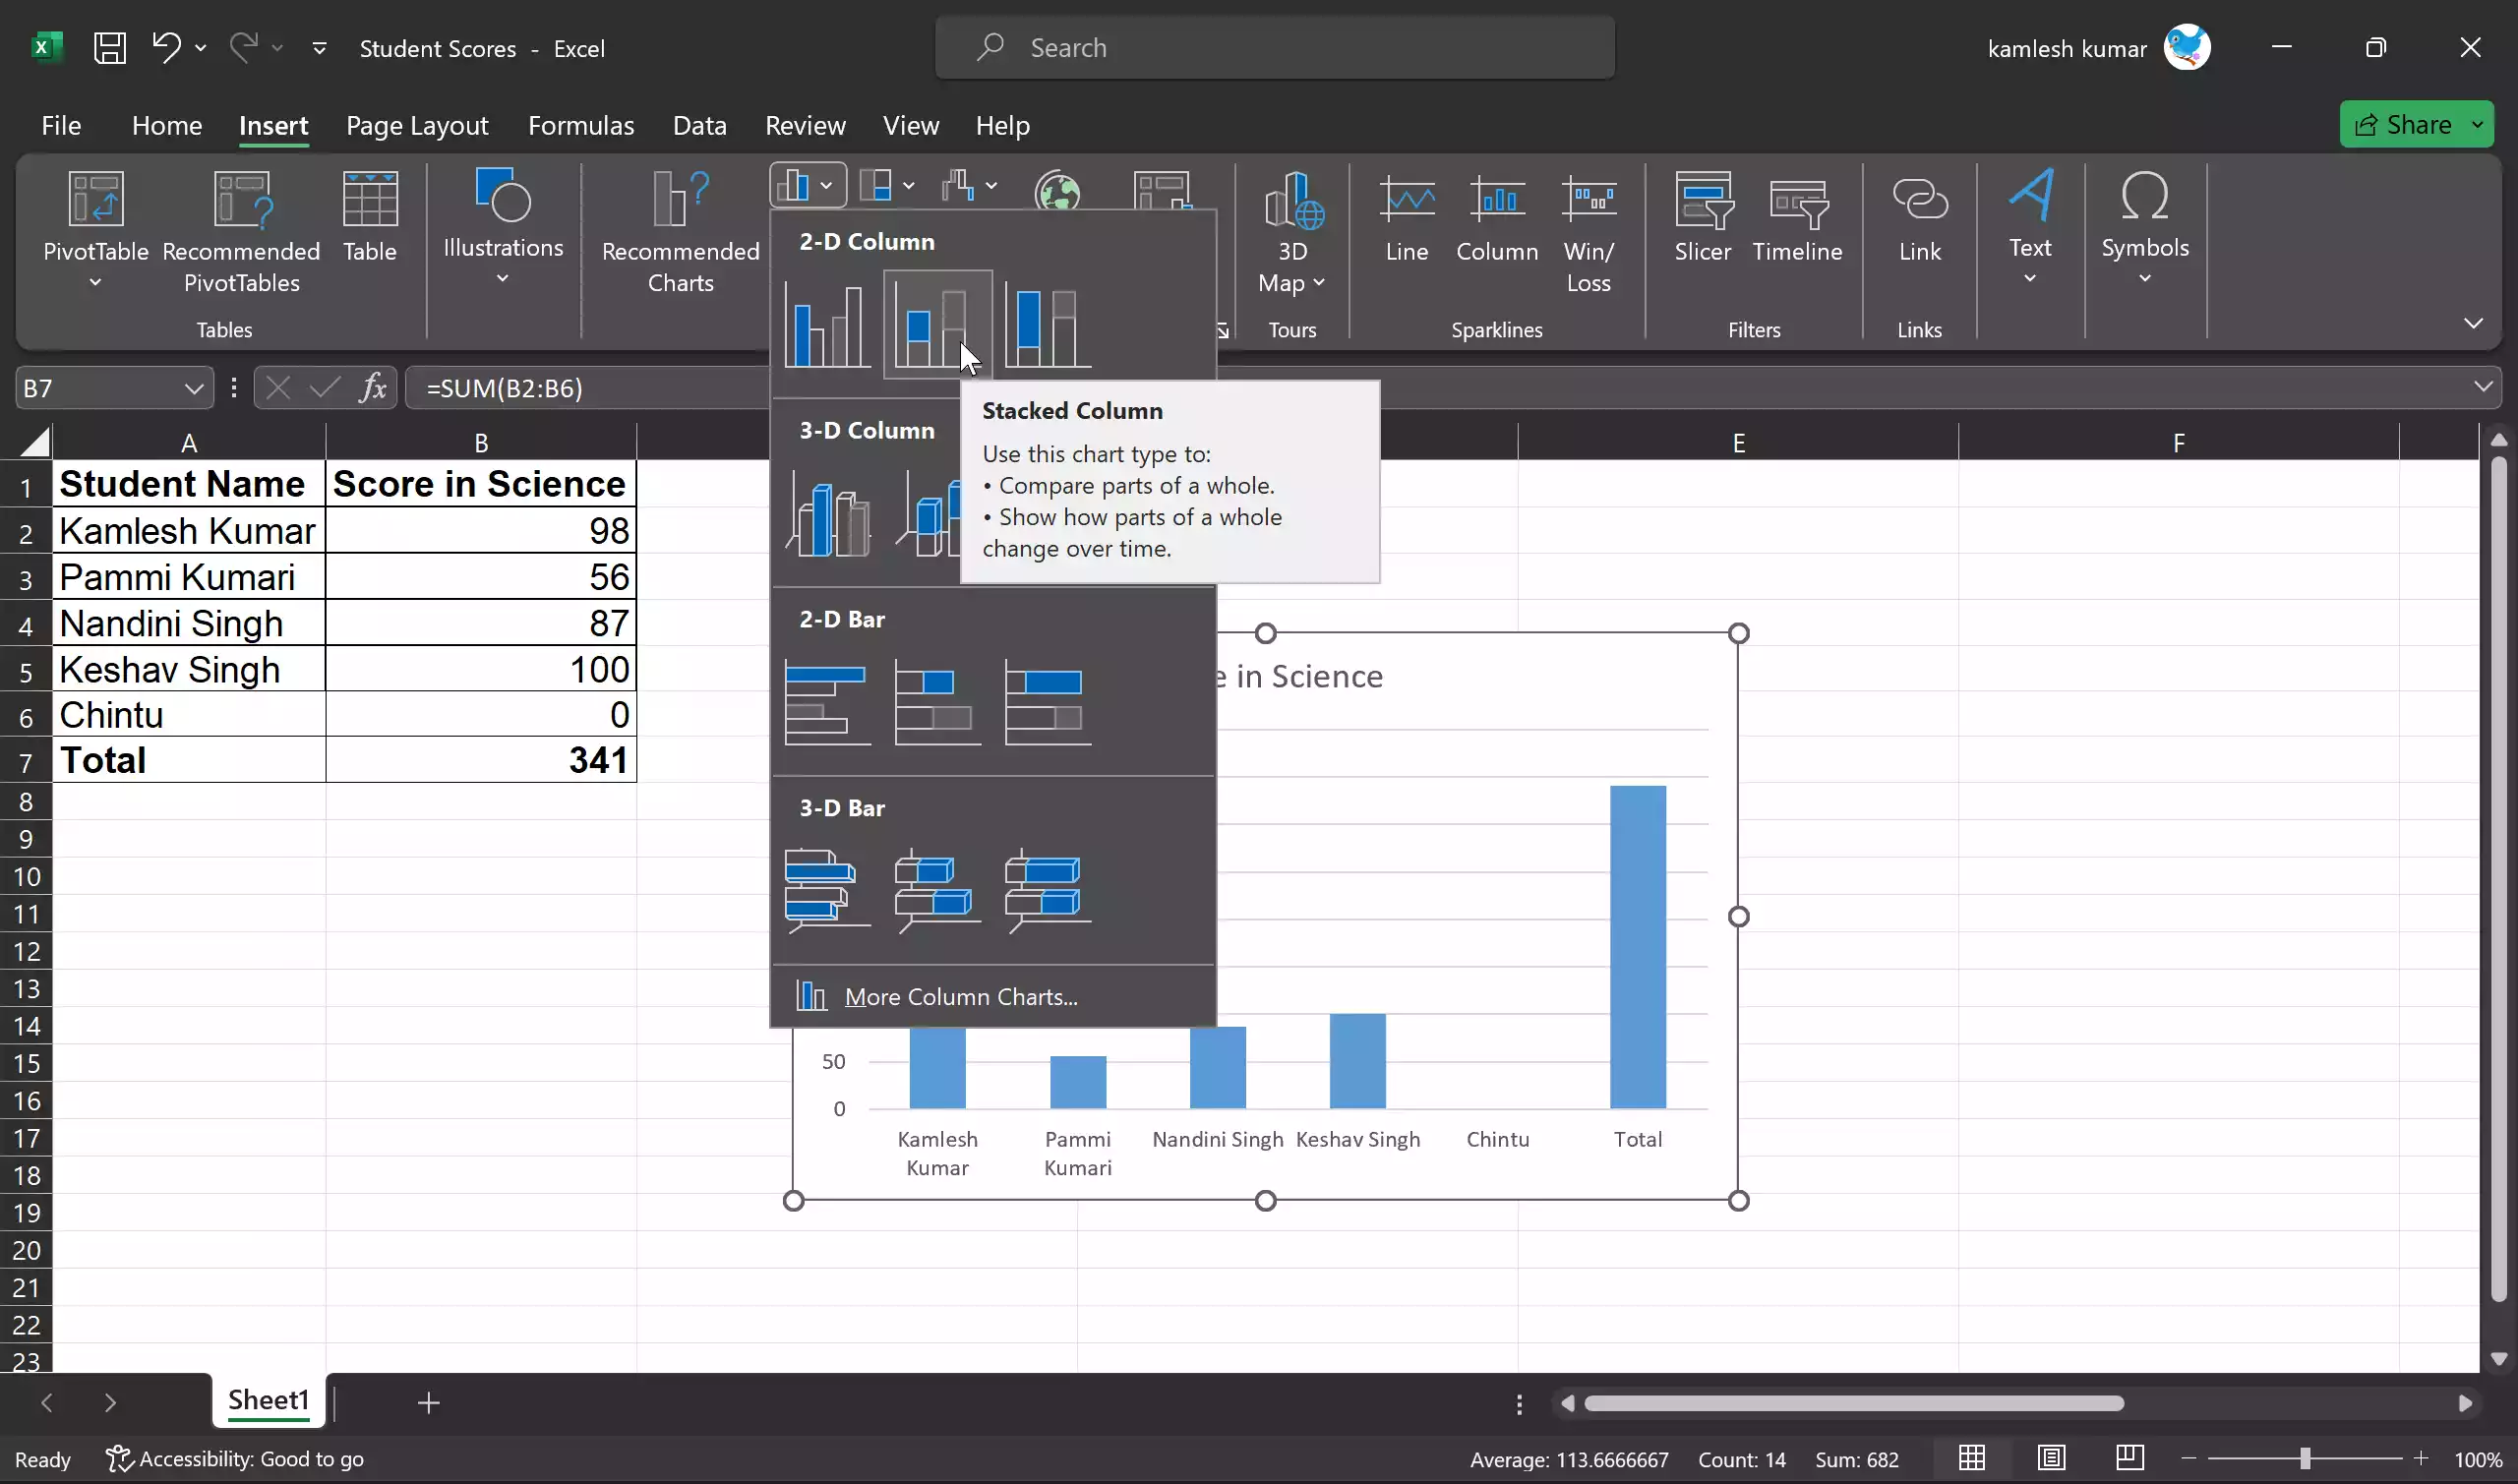
Step 5. Choose the chart type you want to create (e.g., column chart, pie chart, line chart) from the “Charts” group.
Step 6. Customize your chart with titles, labels, and formatting as needed.
Step 7. Ensure your chart looks the way you want it to appear in your Word document.
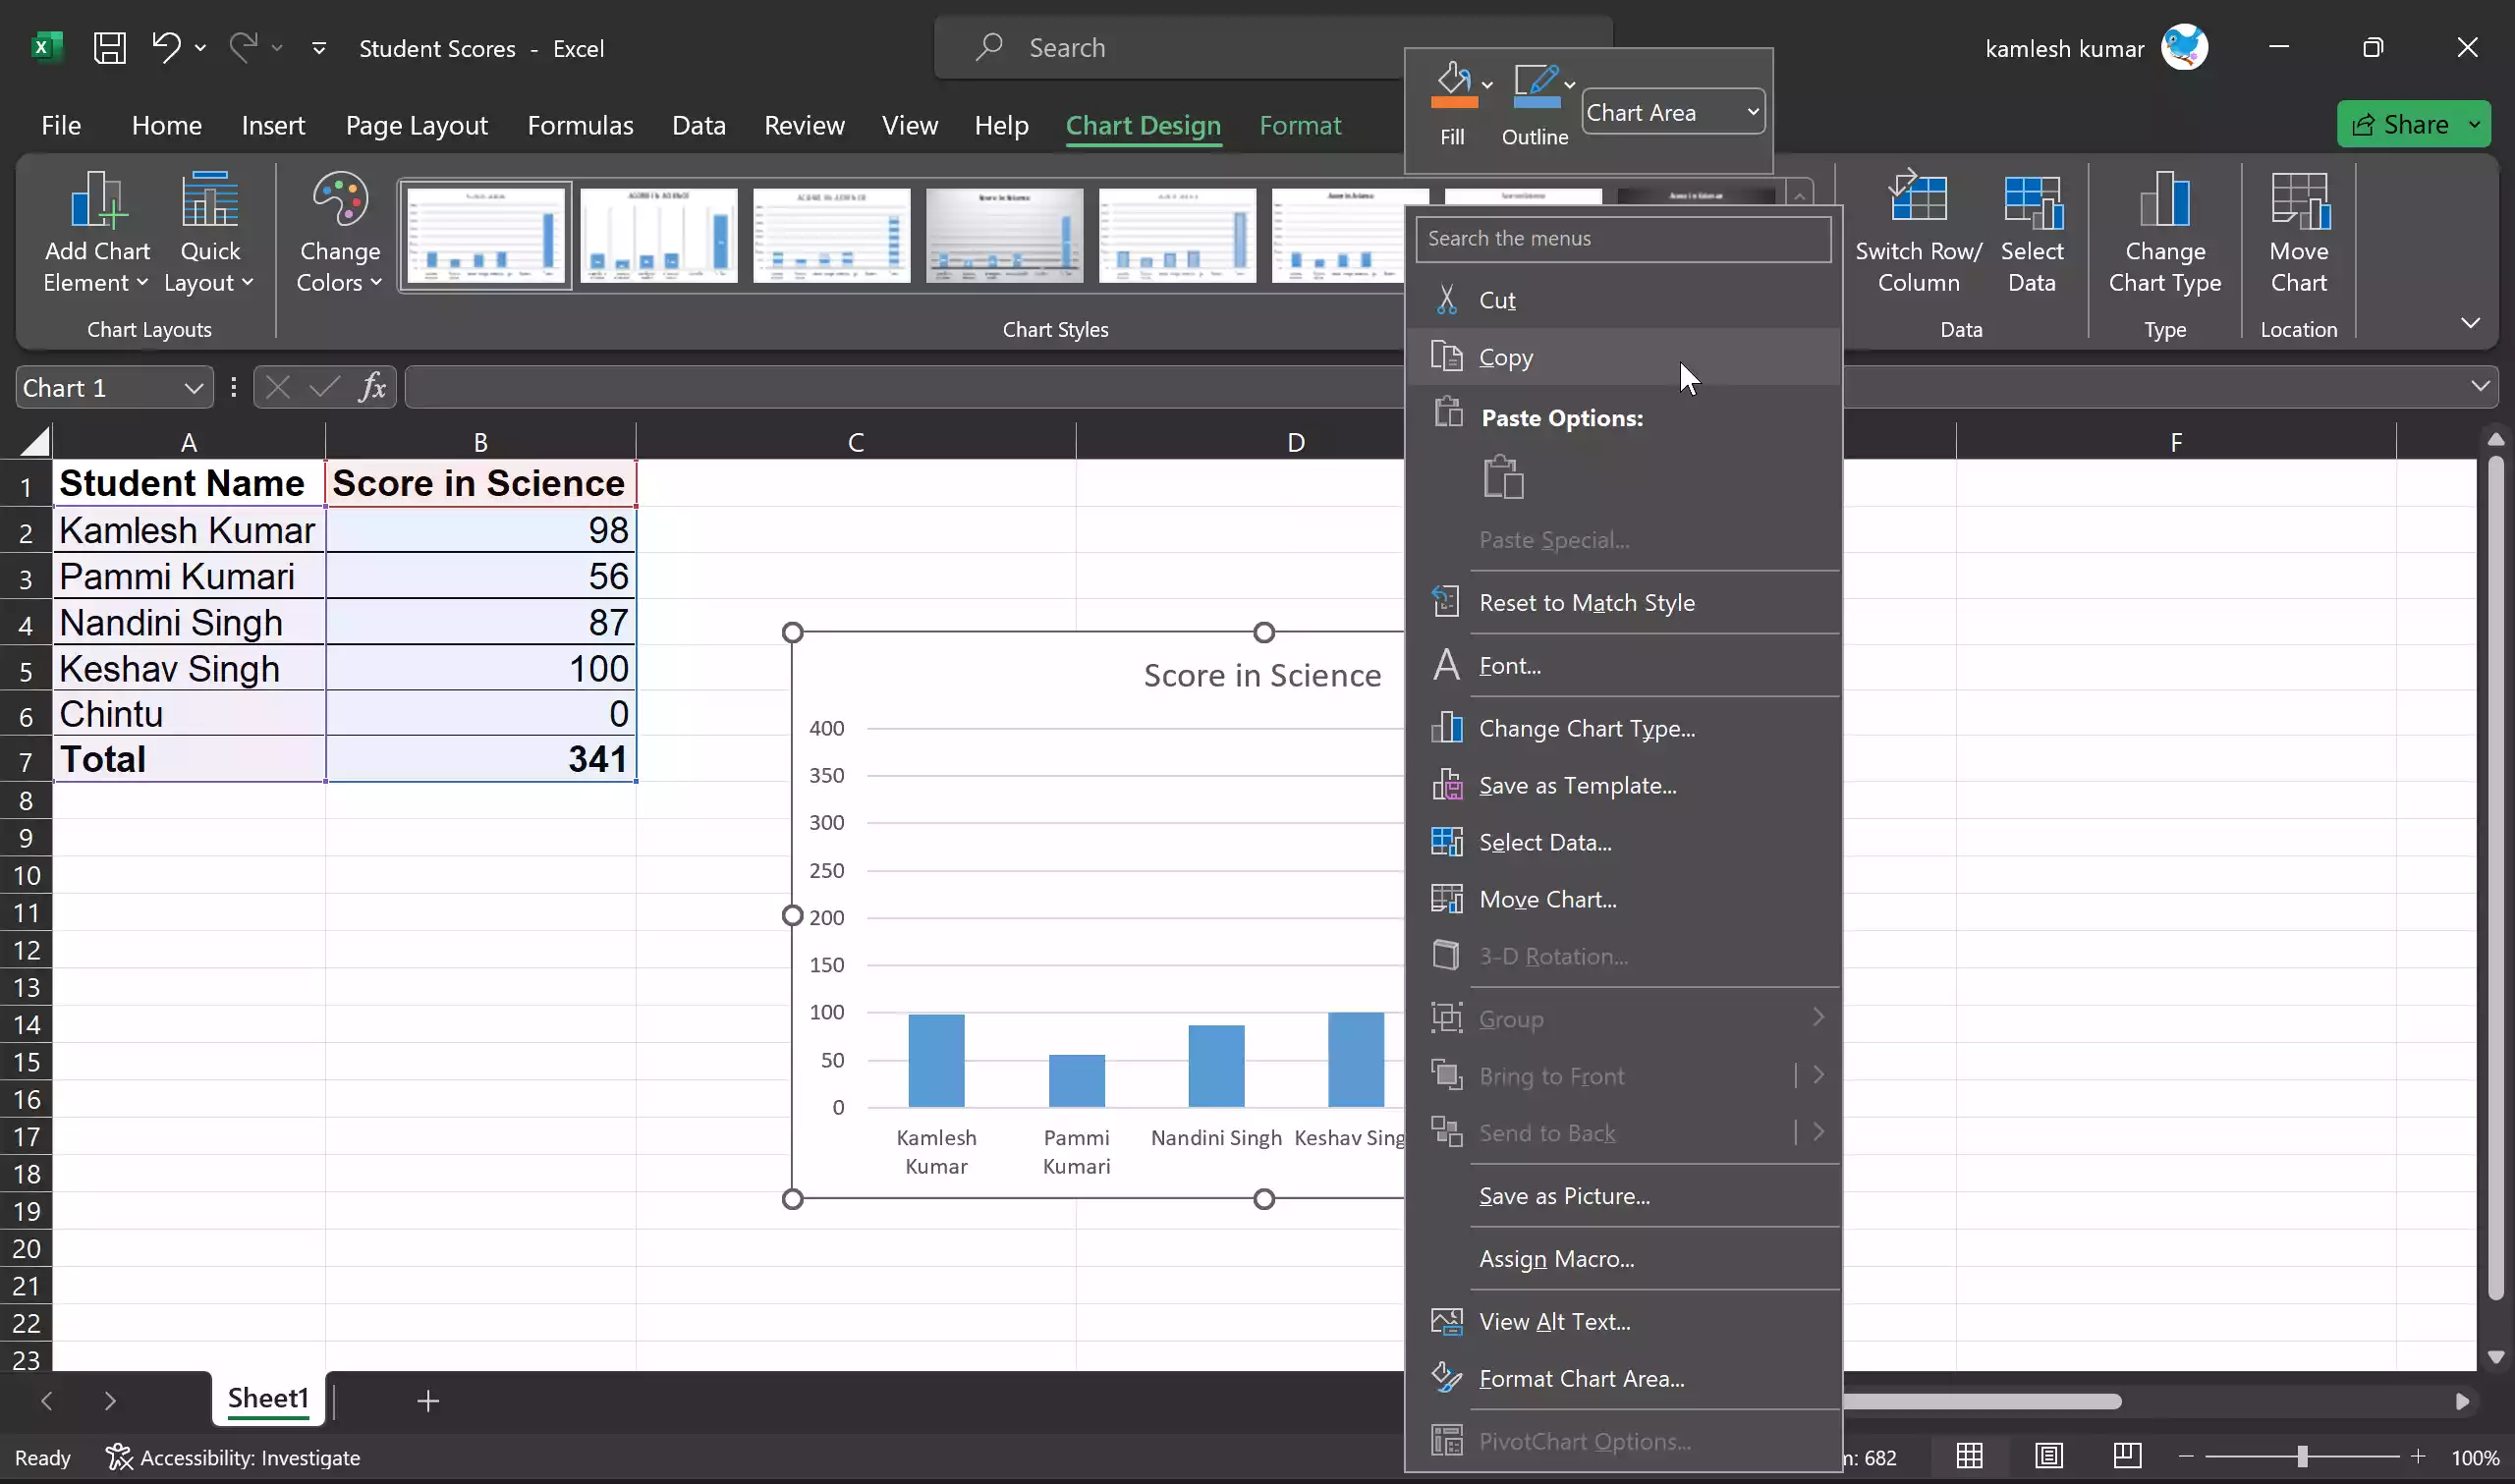
Step 8. Once you’ve created and customized your chart, it’s time to copy it so you can paste it into your Word document. So, click on the chart to select it. A border will appear around the chart.
Step 9. Right-click on the chart and a context menu will appear. From the menu, select “Copy” or press Ctrl + C (Command + C on Mac) to copy the chart to your clipboard.
Step 10. Now, open the Word document where you want to insert the Excel chart.
Step 11. With your Word document open, click where you want to insert the chart within your Word document.
Step 12. Right-click in the desired location and select “Use Destination Theme & Link Data (L)” or “Keep Source Formatting & Link Data (F).”
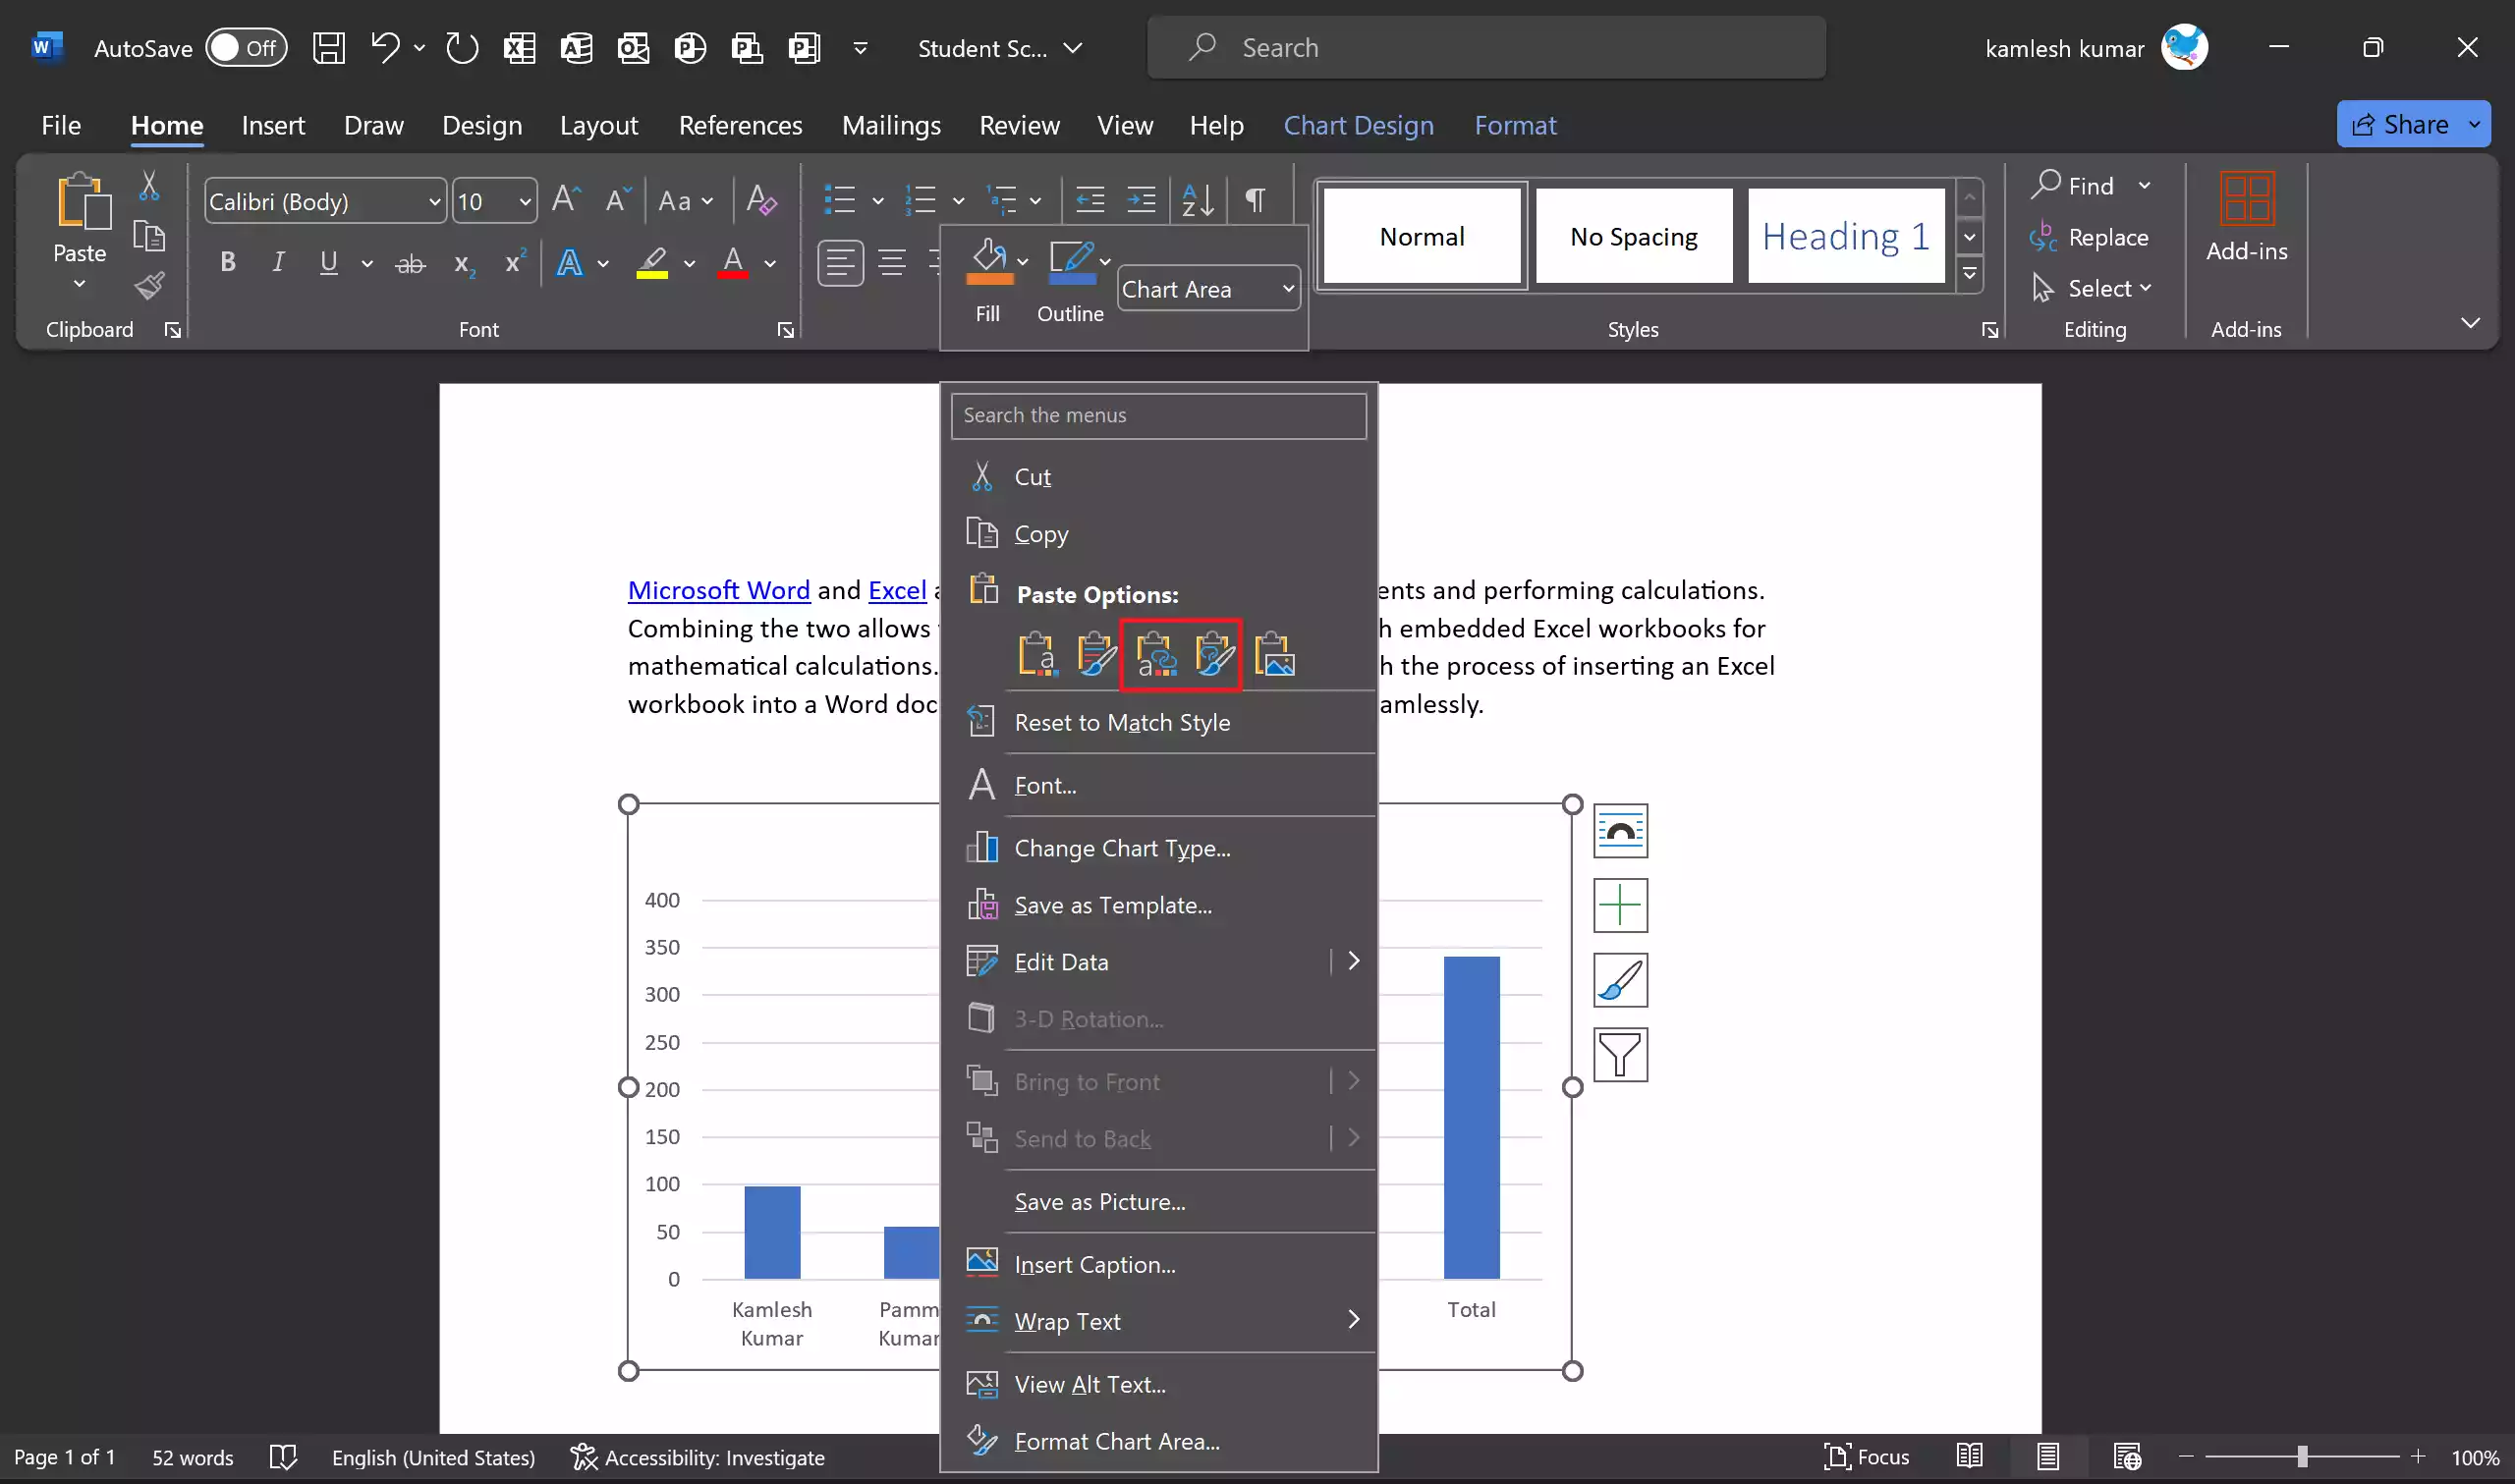
Your Excel chart will now appear within your Word document.

Step 13. Depending on your document’s layout and design, you may need to adjust the size and position of the embedded chart. Click on the chart to select it. You can resize the chart by dragging the corner handles. Hold the Shift key while dragging to maintain the chart’s proportions. To move the chart, click and drag it to the desired location within your document.
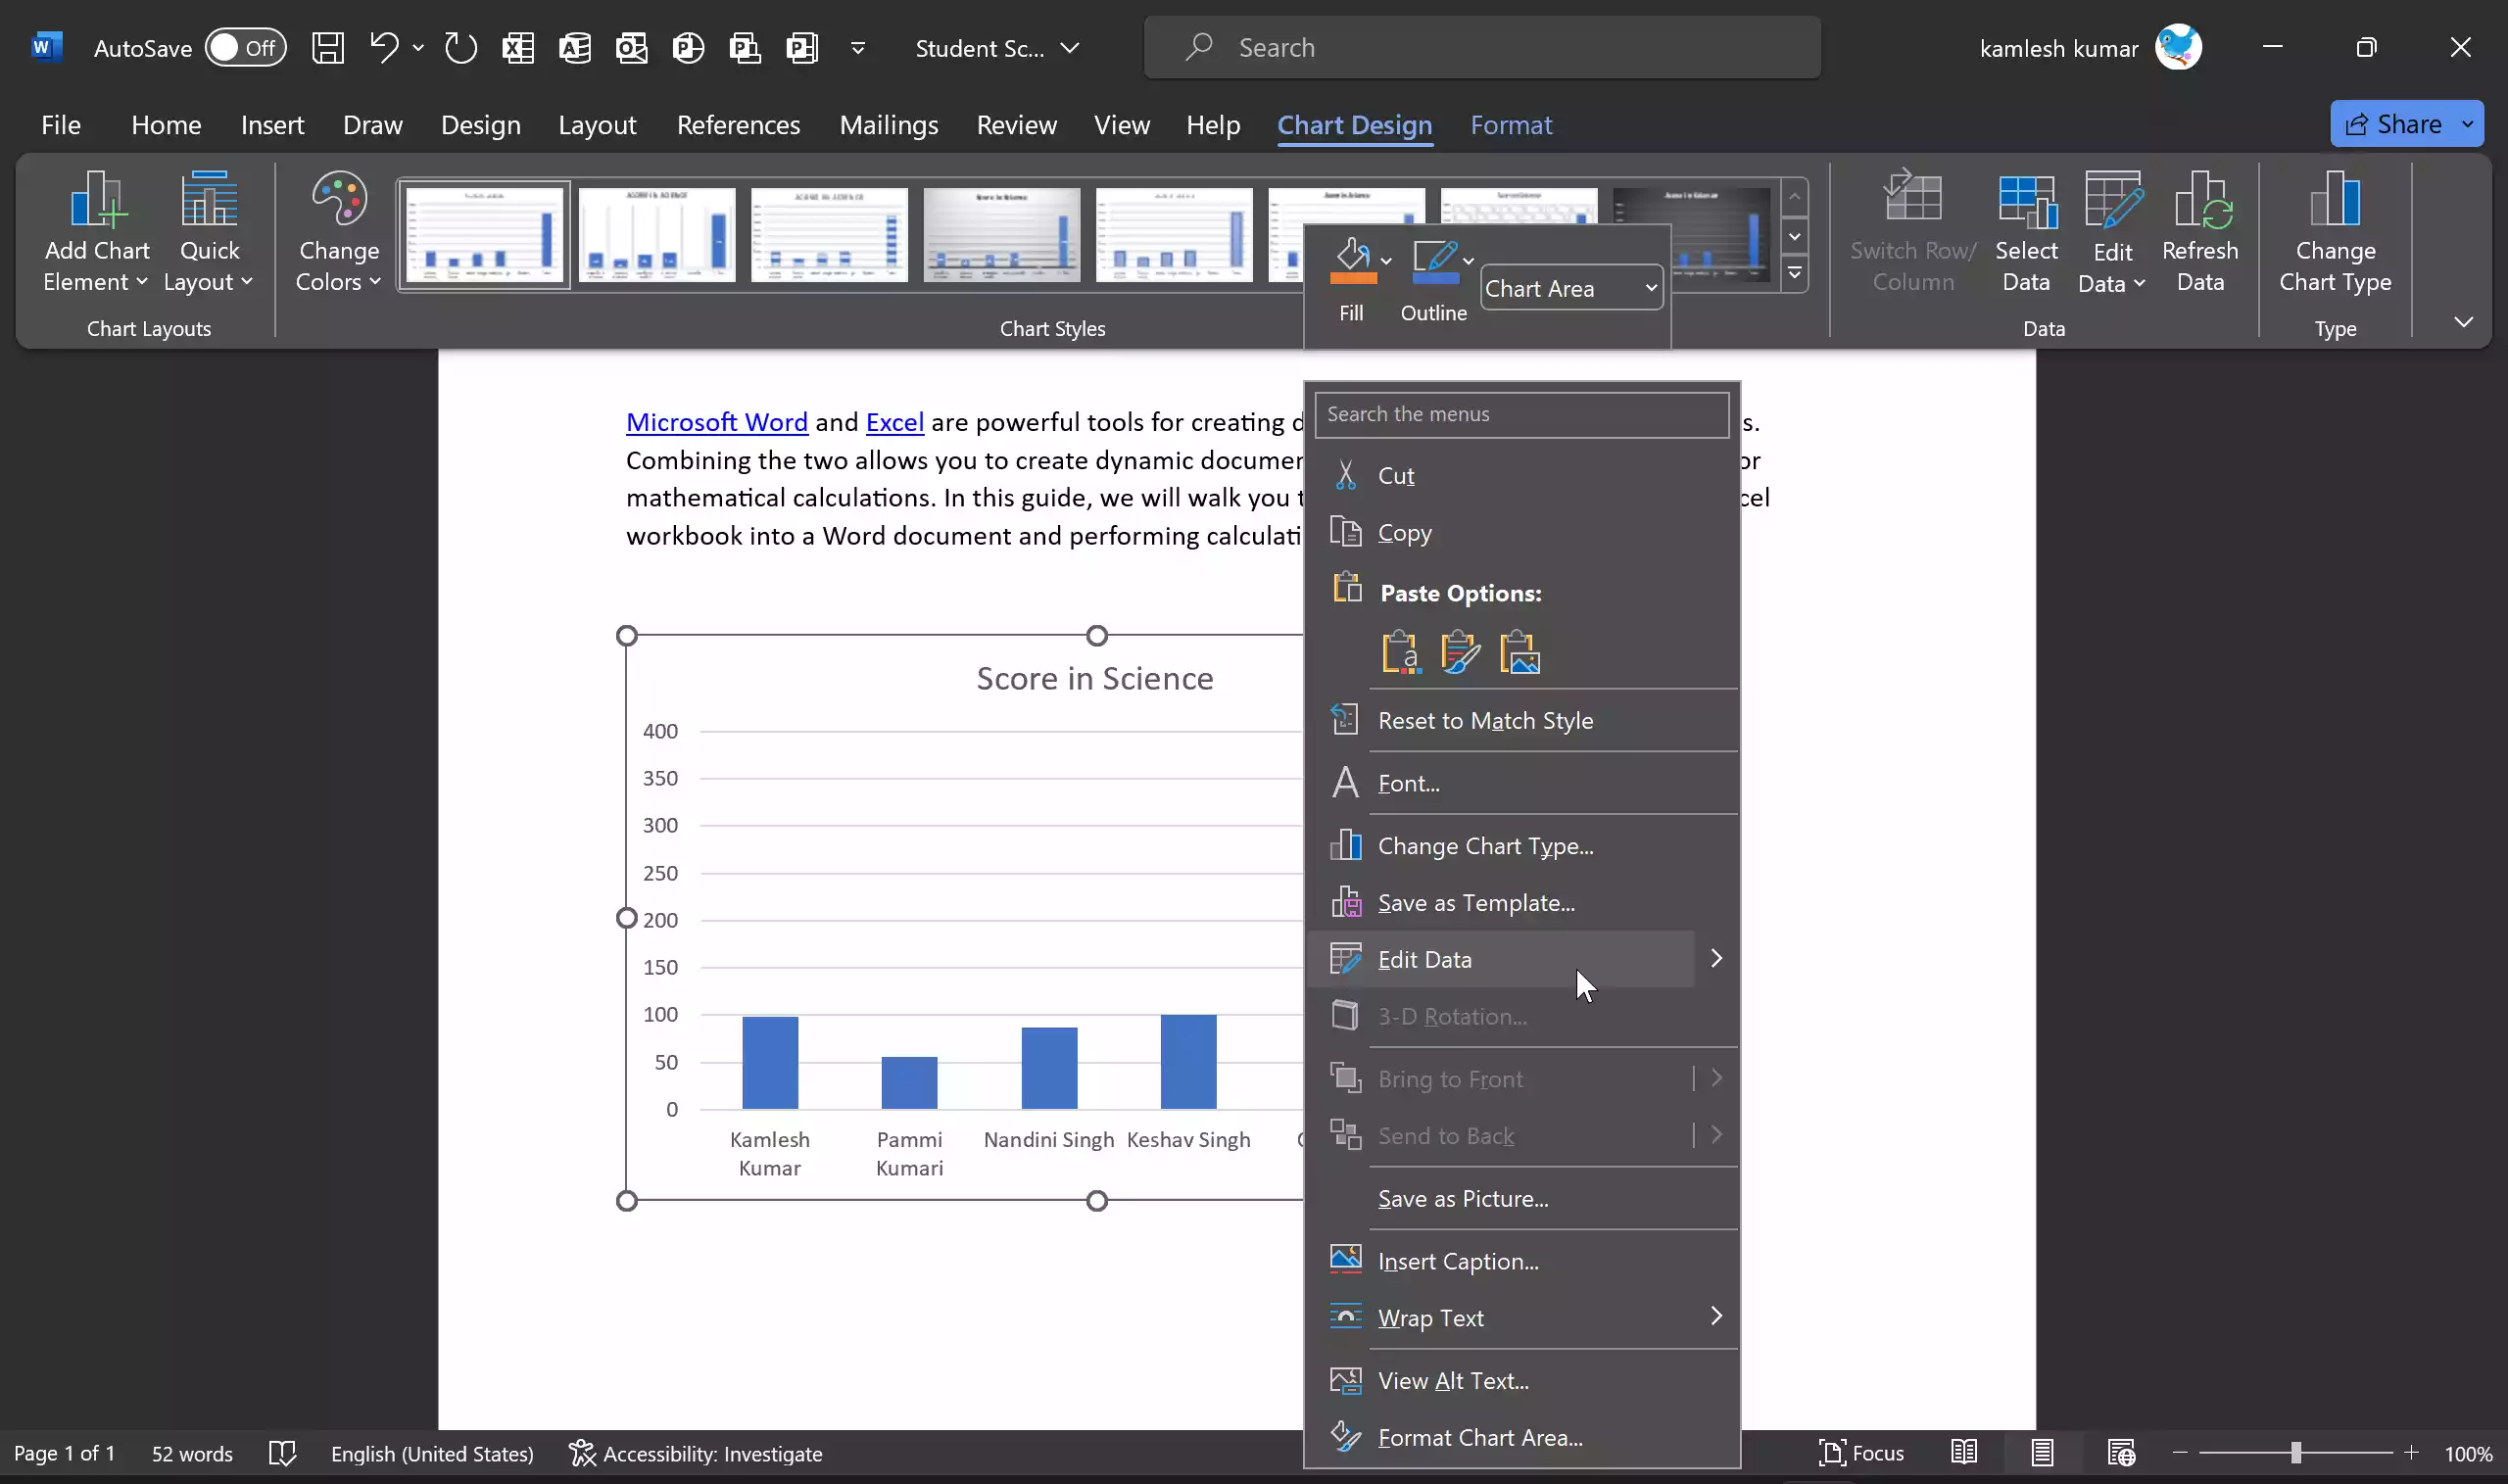
Step 14. If you need to update or modify the data in your embedded chart, you can do so directly from Word. Right-click on the embedded chart and select “Edit Data” in your Word document. This will open the Excel spreadsheet containing your chart data. Make the necessary changes to your data. Close the Excel window, and your chart in Word will automatically update to reflect the changes.
Step 15. To enhance the appearance of your chart within your Word document, you can format and style it further. Right-click on the chart and select “Format Chart Area” or “Format Data Series” to access various formatting options. Experiment with chart styles, colors, and fonts to match your document’s design.
Conclusion
In conclusion, embedding an Excel chart into a Word document is a powerful technique for improving the visual representation of data and making documents more engaging. By following the step-by-step guide provided in this article, you can seamlessly integrate charts into your reports, presentations, and other documents. This not only enhances clarity but also ensures that your data remains dynamic and up-to-date, making it a valuable tool for effective communication.