
In the digital age, where every millisecond counts and a frame drop can make a world of difference, gamers and tech enthusiasts are constantly searching for tools that can optimize their gaming experience. Intel, a forerunner in the tech world, offers an answer with its groundbreaking tool: Intel PresentMon. Dive deep into its capabilities and discover how it can revolutionize your gaming insights. For quick CPU temperature monitoring while you test PresentMon, consider Core Temp to keep an eye on thermals during long sessions.
A New Frontier in Gaming Telemetry
The demand for advanced performance monitoring tools has grown as games become more intricate and demanding. Existing tools like MSI Afterburner and HWiNFO have been the go-to options for monitoring various system parameters. If you want to compare telemetry approaches, Open Hardware Monitor is another well-known telemetry tool to consider. Enter Intel PresentMon — a tool that not only fulfills traditional monitoring roles but pushes the boundaries of what we’ve come to expect from a monitoring application.
Key Features
- Real-time Graphics with Telemetry Capture: PresentMon captures per-frame timing and presentation events to give a detailed picture of rendering and presentation pipelines.
- Unique Metrics: The GPU Busy metric reveals how much time the GPU spends actively working versus waiting — a useful metric to identify CPU/GPU imbalance. For deeper GPU stat breakdowns, check out GPU-Z.
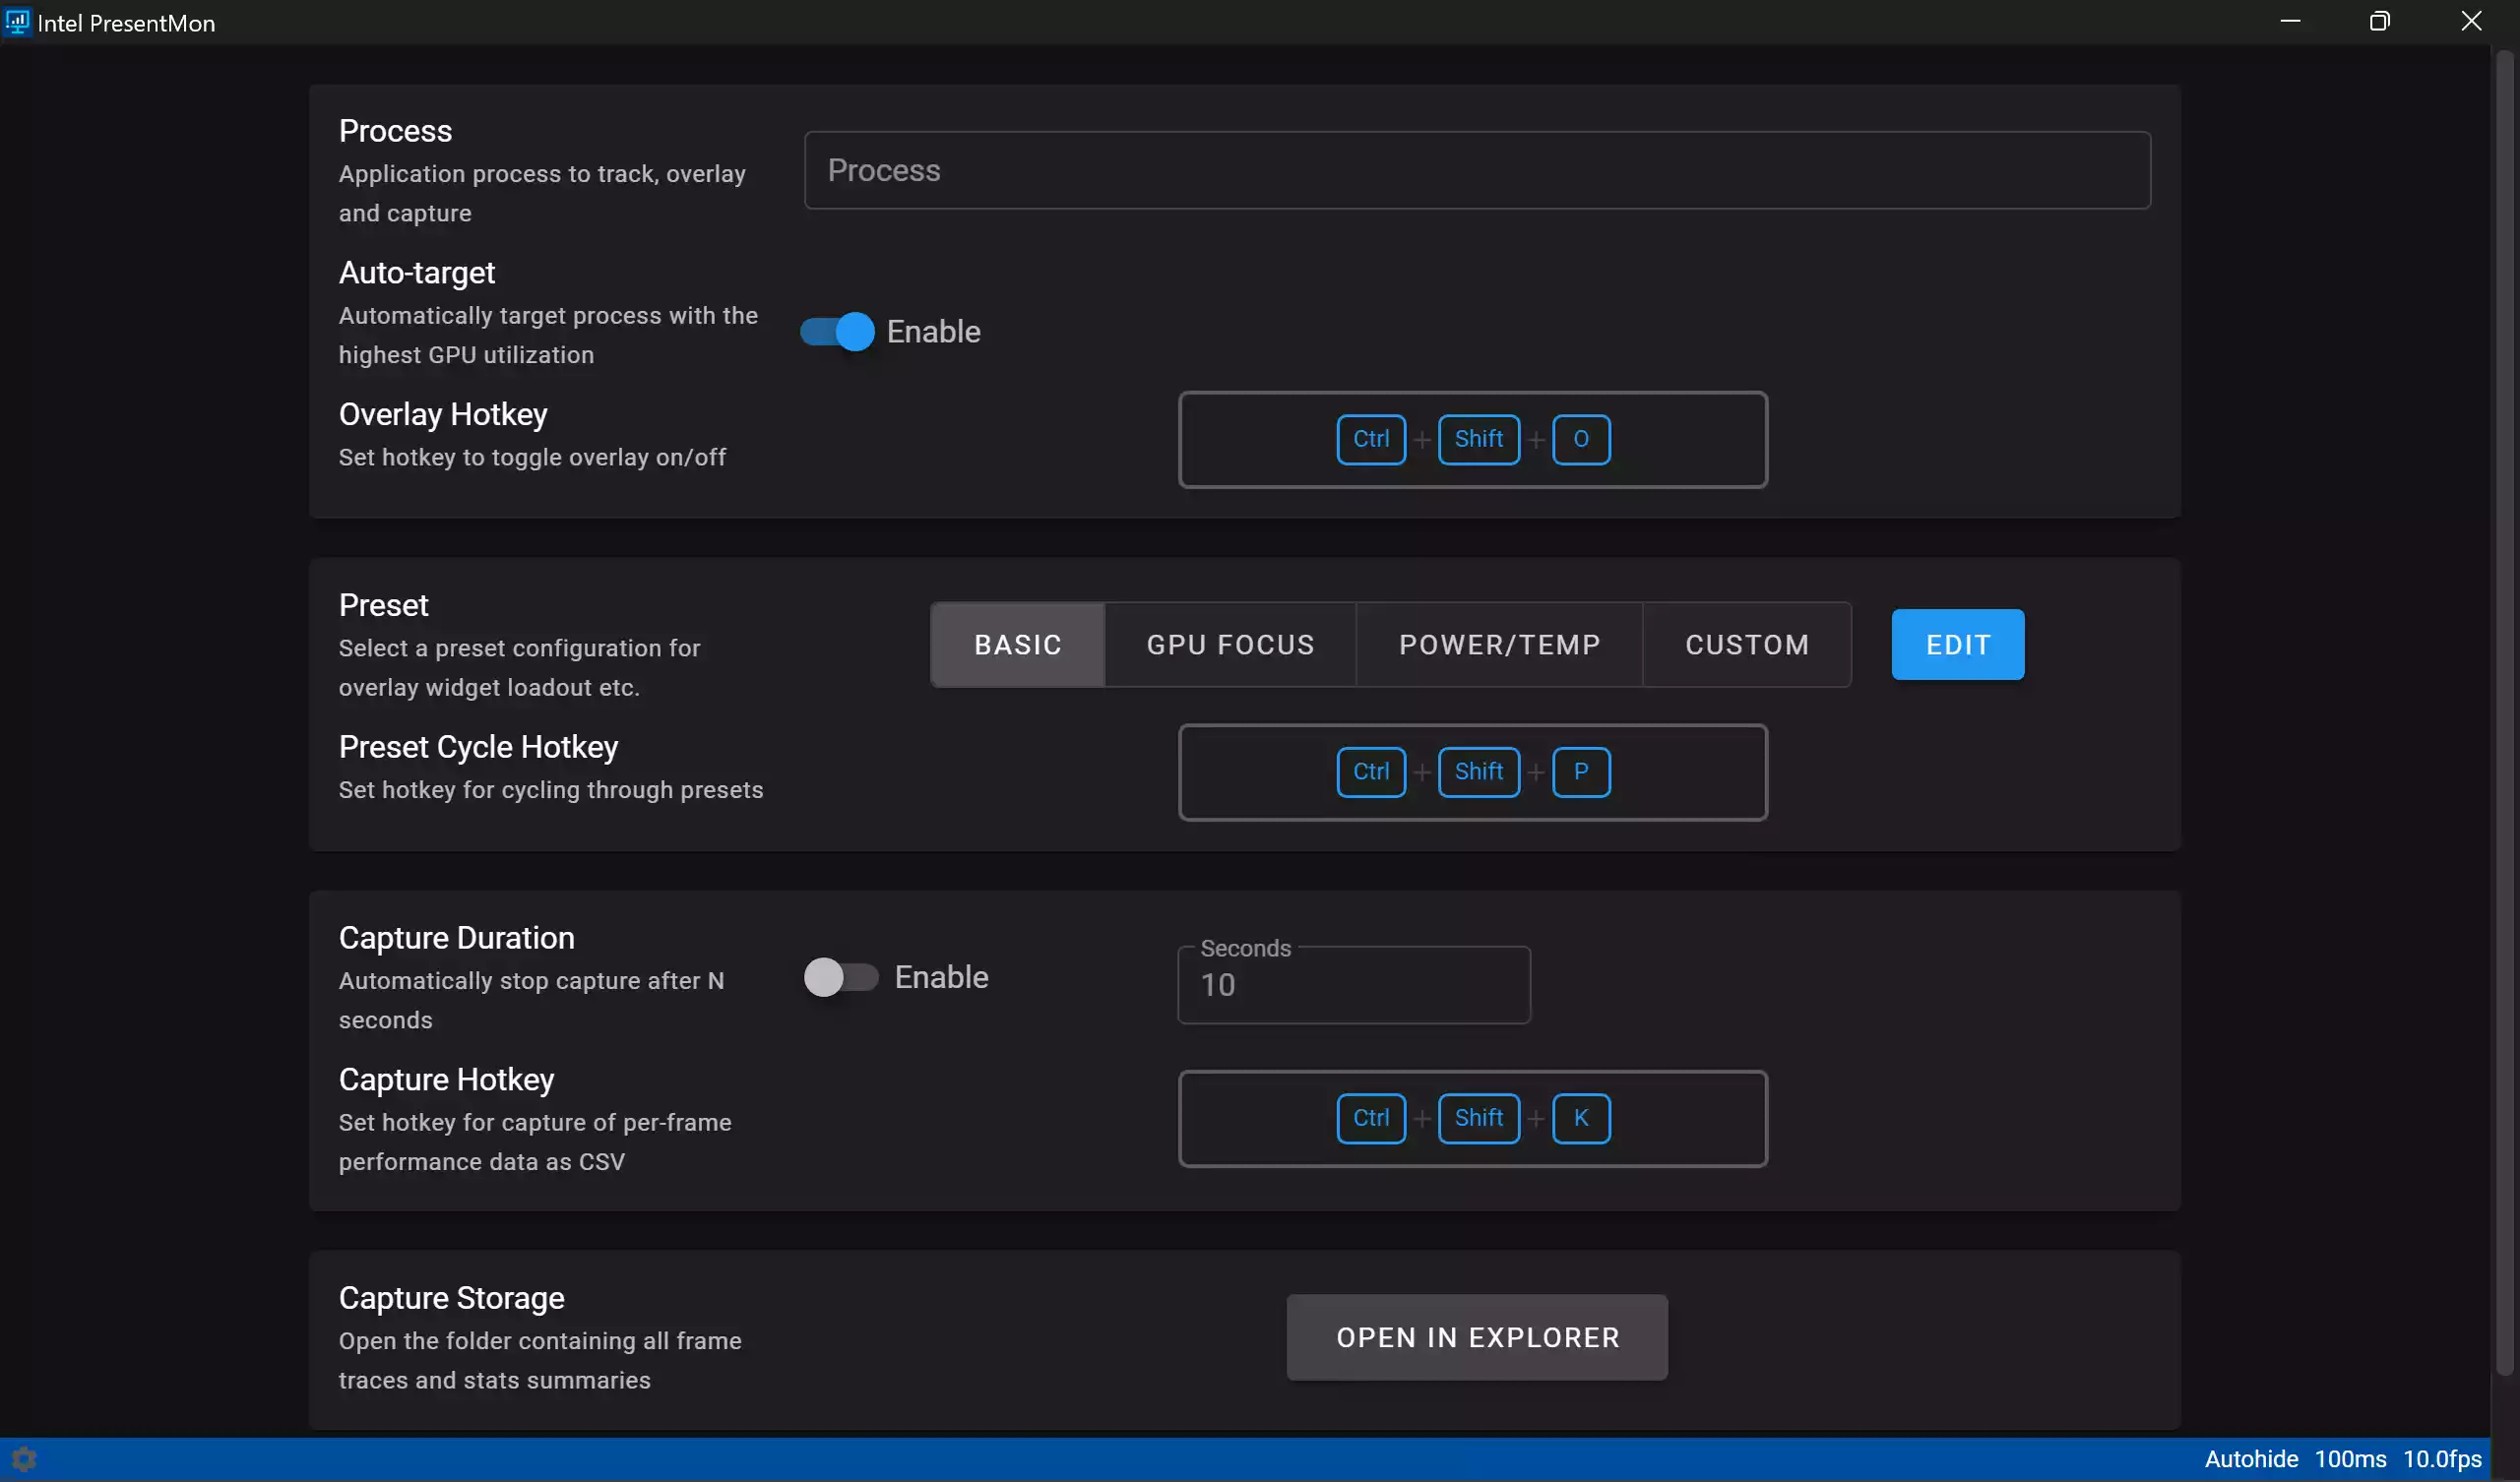
- Customizable Interface: While PresentMon itself is focused on capture and export, frontends and tools that integrate PresentMon data offer configurable views (Process, Preset, Capture Duration, Storage Capture) to fit different workflows.
- Custom and Edit Options: Many PresentMon wrappers and visualizers allow you to tailor displayed charts, choose different chart types, and format exported telemetry for post-analysis.
- Hotkey Configurations: Capture and toggle functionality can be bound to hotkeys in frontends, avoiding interruptions during gameplay. If you’re optimizing system responsiveness alongside PresentMon captures, Process Lasso can help tweak process priorities and responsiveness.
- Open-Source Flexibility: PresentMon’s open-source nature enables third-party integration. Developers can use the PresentMon SDK to expose unique metrics (like GPU Busy) inside custom apps and dashboards.
Why PresentMon Matters
Unlike conventional FPS counters, PresentMon tracks presentation events and frame timings at a low level. This makes it particularly valuable for:
- Identifying presentation-limited scenarios where frames are submitted but not presented on time.
- Understanding whether stutters are caused by CPU-side submission delays or GPU-side bottlenecks.
- Feeding precise telemetry into benchmarking pipelines and automated test rigs.
Getting Started
Eager to experience Intel PresentMon’s capabilities firsthand? Download the tool and documentation from Intel’s official PresentMon page.
Basic steps to begin a simple capture:
Step 1. Download PresentMon (or clone the repository if you prefer building from source).
Step 2. Run PresentMon with the appropriate capture flags (e.g., to capture a specific process or duration).
Step 3. Use a compatible frontend or parse exported CSV logs to visualize frame times and presentation events.
Integration & Ecosystem
Because PresentMon is open-source, several frontends and analytics tools integrate its output. You can plug PresentMon data into dashboards that show per-frame graphs, histograms, and derived metrics. For a compact, always-on readout of system performance alongside telemetry captures, Sidebar Diagnostics makes a handy companion.
FAQs — Intel PresentMon
Q1. Is PresentMon free to use?
Yes — PresentMon is provided as an open-source tool by Intel. You can download and use it freely; check the project page for licensing details.
Q2. Do I need Intel hardware to use PresentMon?
No. PresentMon captures presentation events from the OS/graphics stack and can be useful across hardware vendors, though some advanced telemetry integrations may be vendor-specific.
Q3. Can PresentMon measure input lag?
PresentMon focuses on presentation and frame timing. Measuring end-to-end input-to-display latency typically requires synchronized input measurement hardware and workflows; PresentMon complements such setups by providing frame presentation context.
Q4. How do I analyze PresentMon output?
PresentMon can export CSV logs that you can visualize with spreadsheets or dedicated frontends. Many users import CSVs into analysis scripts or visualization tools to plot frame times, presentation intervals, and derived metrics.
Q5. Are there GUI frontends for PresentMon?
Yes — community frontends and third-party tools integrate PresentMon exports. Developers can also incorporate PresentMon’s SDK into custom applications to build tailored visualizations.
Conclusion
Intel PresentMon is not just another monitoring utility — it’s a specialized telemetry capture tool that brings frame-level visibility into rendering and presentation pipelines. Gamers, developers, and QA engineers will find its detailed metrics, open-source flexibility, and SDK support particularly valuable when diagnosing stutters, balancing workloads, or building benchmarking suites. Pair PresentMon with system monitors and optimization utilities to get the full picture and actionable results.